. 2001 Jul 15;21(14):5229-38.
doi: 10.1523/JNEUROSCI.21-14-05229.2001.

Global structure, robustness, and modulation of neuronal models

Affiliations

Global structure, robustness, and modulation of neuronal models

M S Goldman et al. J Neurosci. .

Abstract

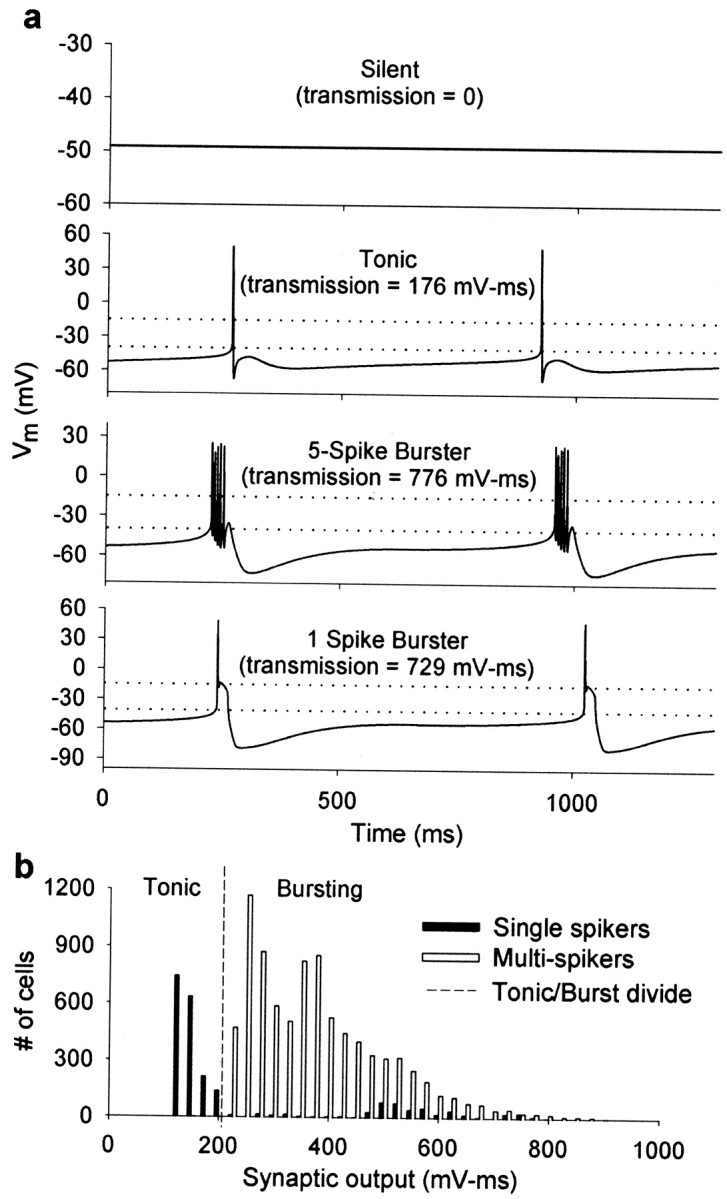
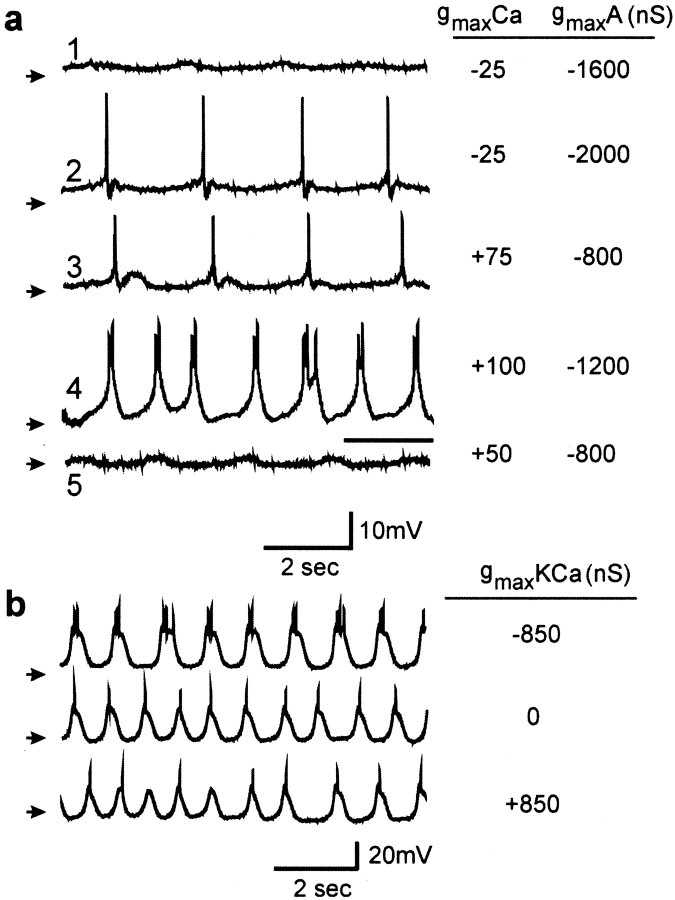
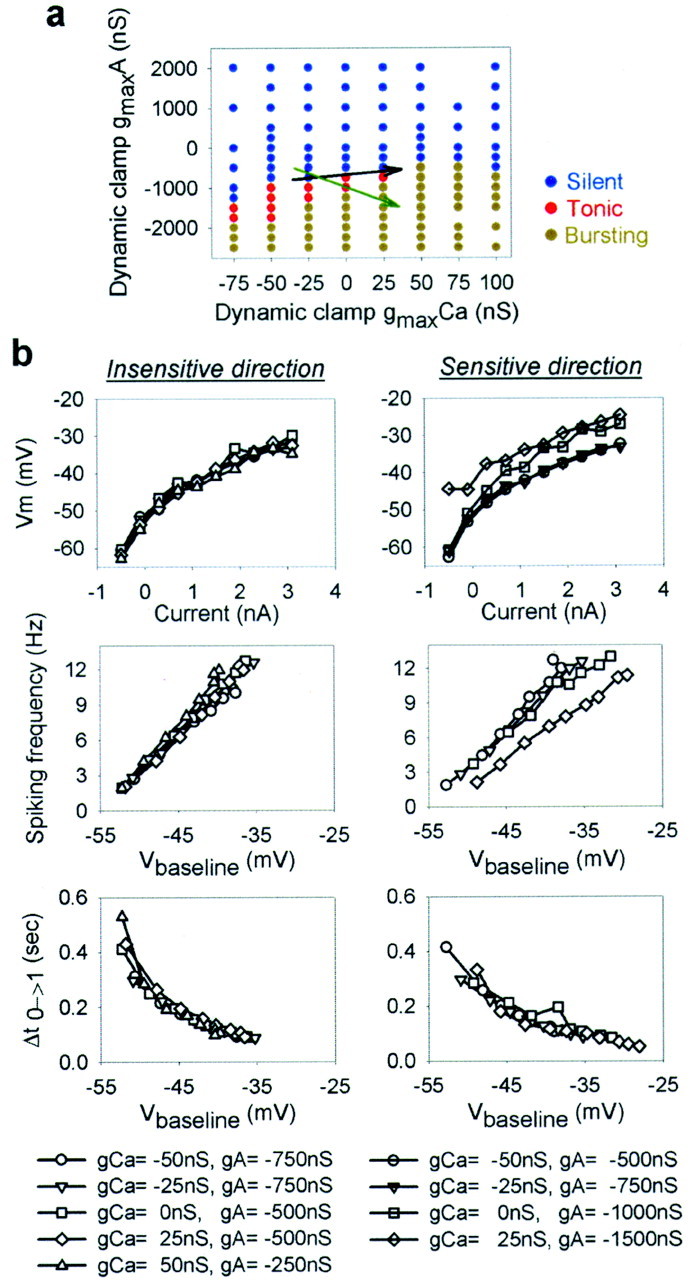
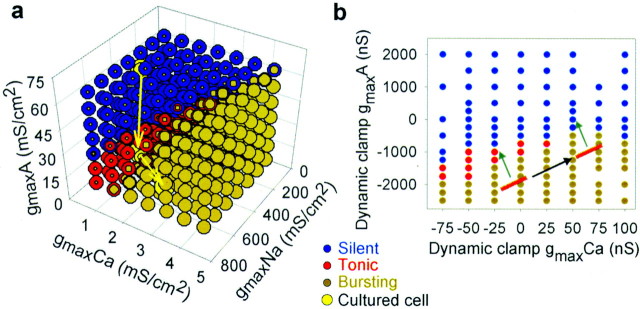
The electrical characteristics of many neurons are remarkably robust in the face of changing internal and external conditions. At the same time, neurons can be highly sensitive to neuromodulators. We find correlates of this dual robustness and sensitivity in a global analysis of the structure of a conductance-based model neuron. We vary the maximal conductance parameters of the model neuron and, for each set of parameters tested, characterize the activity pattern generated by the cell as silent, tonically firing, or bursting. Within the parameter space of the five maximal conductances of the model, we find directions, representing concerted changes in multiple conductances, along which the basic pattern of neural activity does not change. In other directions, relatively small concurrent changes in a few conductances can induce transitions between these activity patterns. The global structure of the conductance-space maps implies that neuromodulators that alter a sensitive set of conductances will have powerful, and possibly state-dependent, effects. Other modulators that may have no direct impact on the activity of the neuron may nevertheless change the effects of such direct modulators via this state dependence. Some of the results and predictions arising from the model studies are replicated and verified in recordings of stomatogastric ganglion neurons using the dynamic clamp.


Figures

Fig. 1.
Fig. 1.
Model-neuron patterns of activity.a, Patterns of activity characteristic of the multiconductance model used in this study. Notice that a neuron firing a single action potential per burst (fourth panelfrom top) could be confused with a tonically firing neuron (second panel) if no other criterion is used. To separate these cases we use the measure of graded synaptic output illustrated in b. Dotted horizontal lines indicate the values Vth = −40 mV and Vsat = −15 mV used in calculating the measure of graded synaptic output (Materials and Methods). b, Distribution of neurons as a function of the graded synaptic output measure. Notice that neurons firing single action potentials (dark bars) occur in two clusters: low measure (corresponding to tonically firing cells) and high measure (corresponding to cells firing single-action-potential bursts). Neurons with multiple action potentials (bursters) all have high synaptic transmission measure. The tonic/bursting divide is 210 mV–msec.
Fig. 2.
Fig. 2.
Differences of maximum conductances as indicators of the state of activity of a neuron. a, Activity of model neurons with similar frequency and action potentials per burst is generated with gmaxCa,gmaxA, andgmaxKCa currents that differ by 1.4-, 7.0-, and 7.0-fold, respectively (inset histograms). b, VaryinggmaxCa, gmaxA, and gmaxKCa only slightly in two other model neurons (1.25-, 1.2-, and 1.0-fold, respectively;inset histograms) induces dramatic changes in the pattern of activity (bursting, top; tonic activity,bottom). gmaxNa = 600 mS/cm2, and gmaxKd = 50 mS/cm2 in all model neurons shown ina and b. c, States of activity observed when all five conductances are varied. Thewidths of the blue, red, and olive annuli are proportional to the percentage of silent, tonic, and bursting cells observed, respectively, as the three conductances shown (gmaxA,gmaxCa, andgmaxNa) are held at the specified values indicated in the graph while the other two (gmaxKCa andgmaxKd) are varied over the ranges 37.5–262.5 and 25–175 mS/cm2, respectively. Theblack arrow represents the direction of least sensitivity, and the green arrow indicates the direction of highest sensitivity to maximum conductance changes.d, The number of spikes per burst produced by the model neurons as a function of three maximal ionic conductance densities. The number of spikes per burst is indicated as follows:black, 0; blue, 1; green, 2; olive, 3; orange, 4; and dark red, 5. Specification of gmaxA,gmaxCa, andgmaxKCa leads to a strong separation of the neurons with two or more spikes per burst into particular regions of the parameter space but reveals little about the organization of the zero- and one-spike bursters. The difference insymbolsizes is for ease of visualization only. In a and b in this figure, and in the following figures, Ca*50 andA*5 indicate that the values forgmaxCa and gmaxA have been multiplied by 50 and 5, respectively.
Fig. 3.
Fig. 3.
Dependence of activity on individual or subsets of conductances. a, States of activity observed when all five conductances are varied randomly over a continuous range. The resulting values of each conductance are reported individually (circles, mean values; error bars, SDs). For almost any given value of any single conductance, all three activity states (silent, tonic, and bursting) are observed. b, States of activity observed when the three K+ conductances (gmaxA,gmaxKCa, andgmaxKd) are held fixed at the values given by the centers of each point in the plot while the two inward conductances are varied over the ranges 100–700 mS/cm2 (gmaxNa) and 0.625–4.375 mS/cm2(gmaxCa). In b, thewidths of the blue, red, and olive annuli are proportional to the percentage of silent, tonic, and bursting cells observed, respectively, with the three conductances shown held at the specified values while the other two are varied over the indicated ranges.
Fig. 4.
Fig. 4.
Effect of dynamic-clamp-injected conductances on the activity of a pharmacologically isolated VD neuron.a, Different levels of gmaxCa and gmaxA (shown in columnsat right) injected in dynamic-clamp mode. TheA current is made up of two components, one transient and one persistent. gmaxA of the transient component is shown in the right-hand column; the sustained component had a gmax that was one-fourth the transient component. Traces 1, 5, Silent activity; traces 2, 3, tonic activity;trace 4, bursting activity. The horizontal bar under trace 4 is 1 sec and applies only totrace 4. b, Different levels ofgmaxKCa (column atright) injected into a VD neuron (cell different from that in a). A constant level ofgmaxCa (+200 nS) was applied to induce bursting throughout. Although the number of action potentials per burst changes severalfold (compare top, bottom traces), bursting activity is maintained, and the bursting frequency changes only 19% between the highest (top trace, 1.88 Hz) and the lowest (bottom trace, 1.52 Hz) frequency.Arrows indicate −50 mV. Parameters used for dynamic-clamped conductances are given in Table 1.
Fig. 5.
Fig. 5.
Effect of dynamic-clamp-injected conductances on the parameter space structure of a neuron. a, Activity states of a (biological) IC neuron as a function ofgmaxCa andgmaxA injected with dynamic clamp (blue, silent; red, tonic;olive, bursting). The end andtip of the black arrow indicate the start and end of movement, respectively, induced with the dynamic clamp along the insensitive direction; the end andtip of the green arrow indicate the start and end of movement, respectively, induced along a more sensitive direction. Negative conductance values denote removal of the corresponding conductance from the cell with the dynamic clamp.b, Effect of moving along the insensitive direction (left column) or sensitive direction (right column) in the map in a on the current-versus-voltage relationship (top row), spiking frequency versus membrane potential (middle row), and delay to first spike (after a 2 sec hyperpolarizing current pulse to −90 mV) versus membrane potential (bottom row). Vm is the voltage measured at the approximate steady state between two well separated action potentials at the end of the current-clamp pulse. Vbaseline was manipulated in current clamp and is defined as the average of the minimum voltages between the first three action potentials.
Fig. 6.
Fig. 6.
Effect of dynamic-clamp-injected conductances on the parameter space structure of a neuron.a, Activity states of a (biological) VD neuron as a function of gmaxCa andgmaxA (blue, silent;red, tonic; olive, bursting). Data were comparable in three other experiments and correspond to neurons different from that in Figure 4. Top, Control.Bottom, Same as top but in the presence of dynamic-clamp-added proctolin-activated current (gmaxProc = 10 nS).Labels 1 and 2 highlightpoints that in control conditions (top) lie at the border of the tonic-bursting regions but that in proctolin are both within the tonic region of activity. b, Activity states of the model neuron as a function ofgmaxCa and gmaxA,gmaxNa = 200 mS/cm2;gmaxKCa = 150 mS/cm2; gmaxKd = 150 mS/cm2. Top, Control.Bottom, Same as top but with the proctolin-activated current included at a fixed maximum conductance (gmaxProc = 0.0025 mS/cm2). c, Activity states of the model neuron when gmaxA,gmaxCa, andgmaxNa are held fixed whilegmaxKCa andgmaxKd are varied over the ranges 37.5–262.5 and 25–175 mS/cm2, respectively, andgmaxProc is fixed at 0.0025 mS/cm2. The widths of theblue, red, and oliveannuli are proportional to the percentage of silent, tonic, and bursting cells observed, respectively, with the three conductances shown held at the specified values while the other two are varied over the indicated ranges. Note the broader tonic (red) region when compared with that in Figure 2c in which the proctolin current is absent.
Fig. 7.
Fig. 7.
Regulation of activity in biological neurons in culture. a, Superimposed data from Figure2c and from Turrigiano et al. (1995). Peak current densities (nA/nF) ICa,INa, andIA of STG cultured neurons (Turrigiano et al., 1995) change as the neurons change their states of activity in a progression of silent to tonic to bursting during the 3–4 d in culture subsequent to enzymatic and mechanical dissociation (yellow points). We assume that the values ofgmaxCa, gmaxNa, and gmaxA are proportional to the values ofICa,INa, andIA of these cultured neurons and normalize the mean values of the maximal conductances so that the normalized value of the tonic cells lies near the center of mass of the tonic region (red) in the model. The other twopoints occur automatically in the corresponding silent and bursting regions. b, State dependence of modulatory action. Background, Same as Figure5a. Foreground, A group of similarly functioning cells represented by an orange rectangle aligned with the insensitive direction. A modulator that moves cells (orange rectangles) along the insensitive direction (black arrow) has no effect on activity by itself. However, a comodulator (green arrows) acting along the sensitive direction has a very different effect (bursting to tonic vs bursting to silent) when in the presence of the first modulator.

References

    1. Akopian AN, Souslova V, England S, Okuse K, Ogata N, Ure J, Smith A, Kerr BJ, McMahon SB, Boyce S, Hill R, Stanfa LC, Dickenson AH, Wood JN. The tetrodotoxin-resistant sodium channel SNS has a specialized function in pain pathways. Nat Neurosci. 1999;2:541–548. - PubMed
    1. Bal T, Nagy F, Moulins M. Muscarinic modulation of a pattern-generating network: control of neuronal properties. J Neurosci. 1994;14:3019–3035. - PMC - PubMed
    1. Baxter DA, Byrne JH. Ionic conductance mechanisms contributing to the electrophysiological properties of neurons. Curr Opin Neurobiol. 1991;1:105–112. - PubMed
    1. Beer RD, Chiel HJ, Gallagher JC. Evolution and analysis of model CPGs for walking. II. General principles and individual variability. J Comput Neurosci. 1999;7:119–147. - PubMed
    1. Brickley SG, Revilla V, Cull-Candy SG, Wisden W, Farrant M. Adaptive regulation of neuronal excitability by a voltage-independent potassium conductance. Nature. 2001;409:88–92. - PubMed

Publication types

Substances

LinkOut - more resources