. 2001 Aug;21(15):5262-75.
doi: 10.1128/MCB.21.15.5262-5275.2001.

G(alpha)11 signaling through ARF6 regulates F-actin mobilization and GLUT4 glucose transporter translocation to the plasma membrane

Affiliations

G(alpha)11 signaling through ARF6 regulates F-actin mobilization and GLUT4 glucose transporter translocation to the plasma membrane

A Bose et al. Mol Cell Biol. 2001 Aug.

Abstract

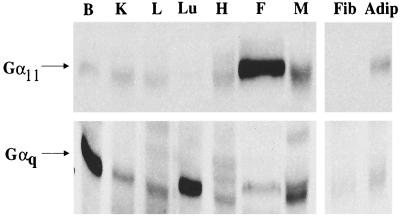
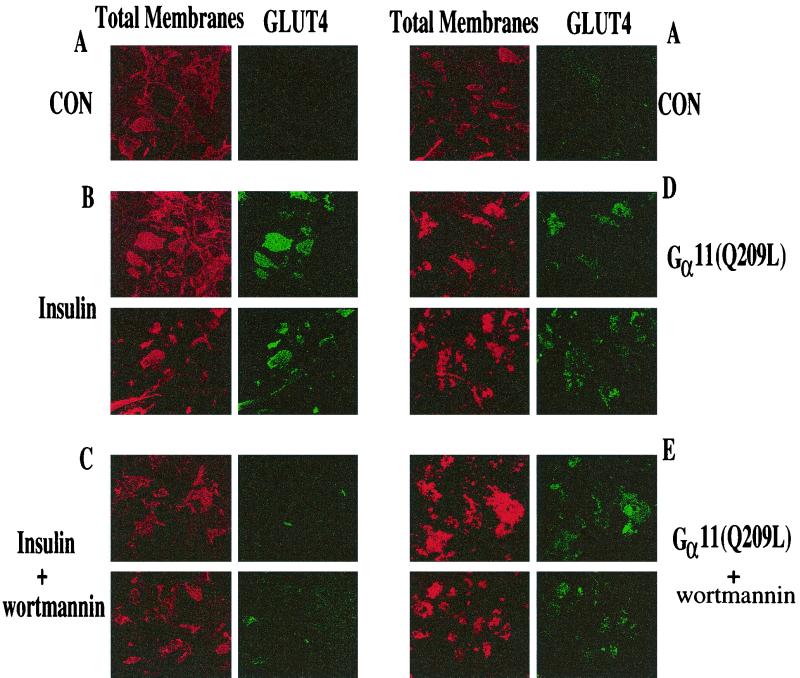
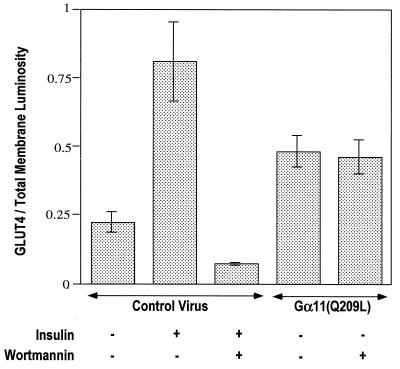
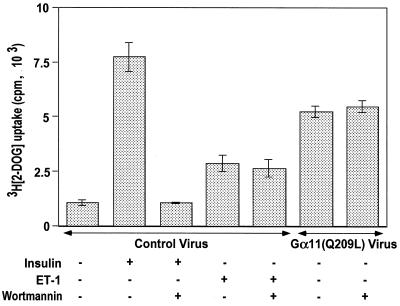
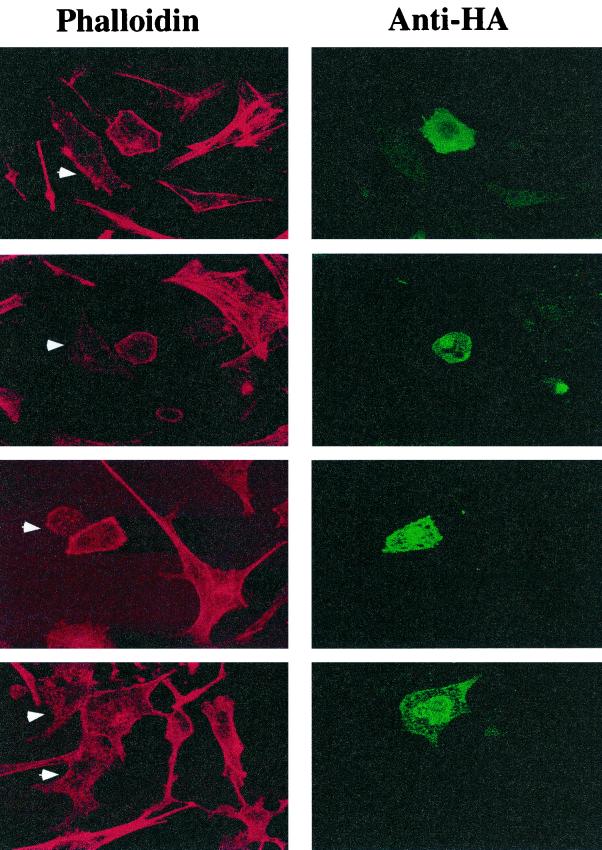
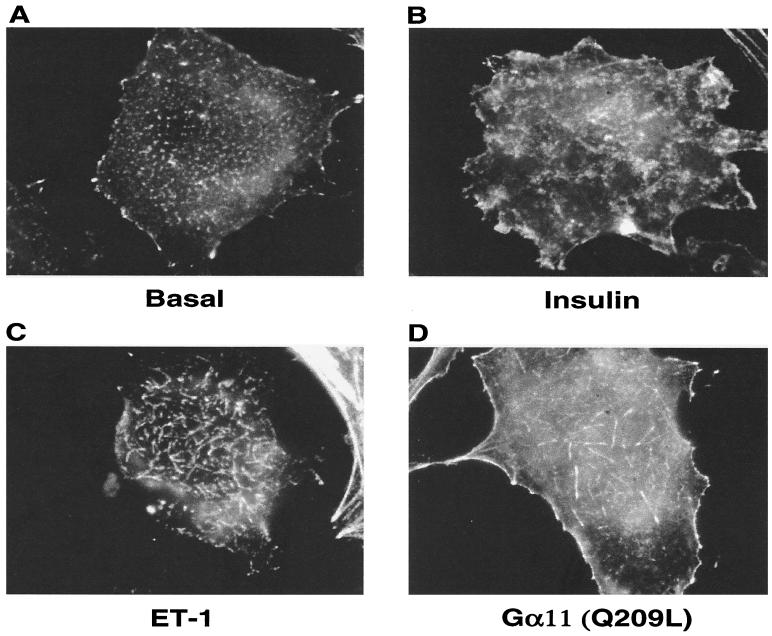
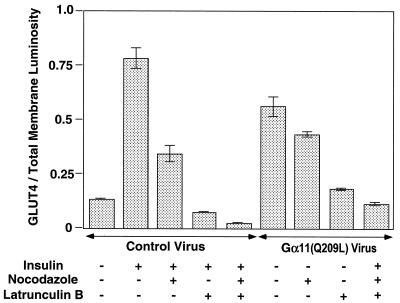
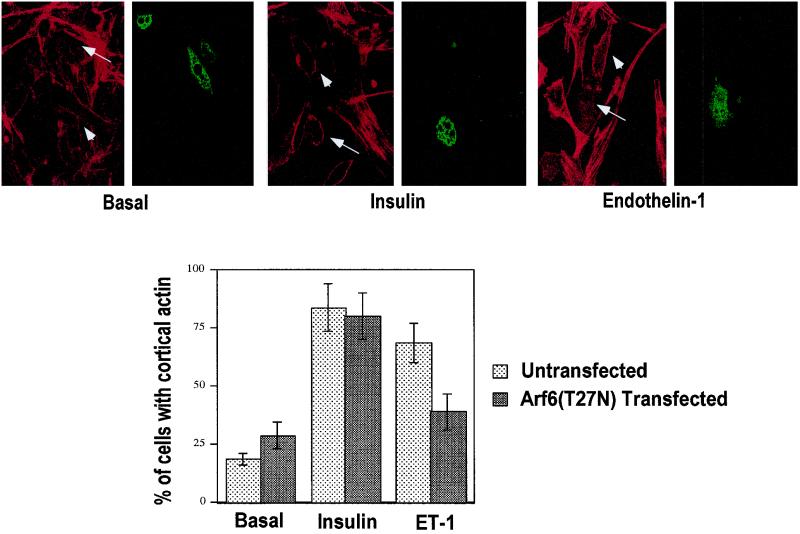
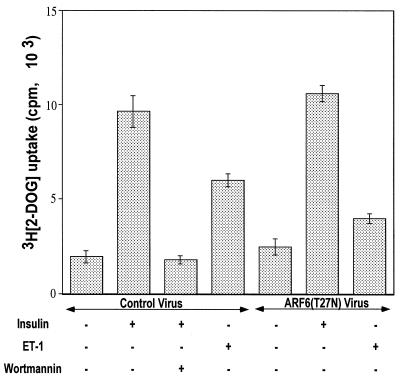
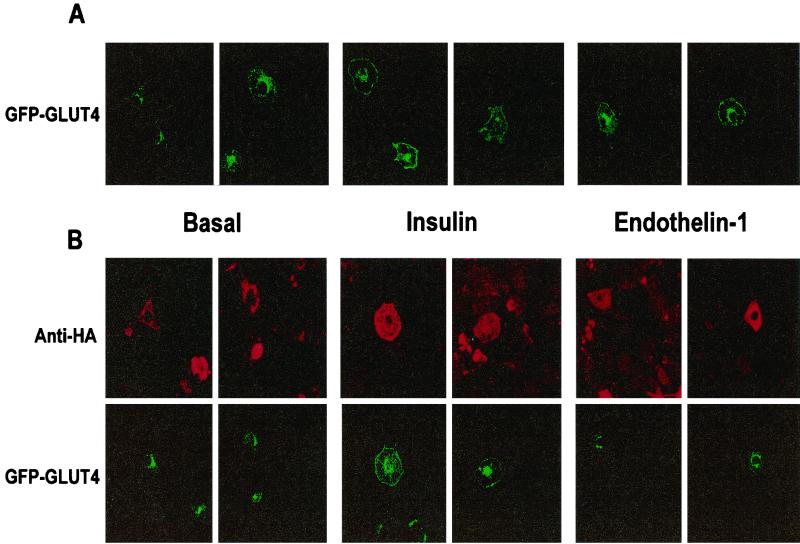
The action of insulin to recruit the intracellular GLUT4 glucose transporter to the plasma membrane of 3T3-L1 adipocytes is mimicked by endothelin 1, which signals through trimeric G(alpha)q or G(alpha)11 proteins. Here we report that murine G(alpha)11 is most abundant in fat and that expression of the constitutively active form of G(alpha)11 [G(alpha)11(Q209L)] in 3T3-L1 adipocytes causes recruitment of GLUT4 to the plasma membrane and stimulation of 2-deoxyglucose uptake. In contrast to the action of insulin on GLUT4, the effects of endothelin 1 and G(alpha)11 were not inhibited by the phosphatidylinositol 3-kinase inhibitor wortmannin at 100 nM. Signaling by insulin, endothelin 1, or G(alpha)11(Q209L) also mobilized cortical F-actin in cultured adipocytes. Importantly, GLUT4 translocation caused by all three agents was blocked upon disassembly of F-actin by latrunculin B, suggesting that the F-actin polymerization caused by these agents may be required for their effects on GLUT4. Remarkably, expression of a dominant inhibitory form of the actin-regulatory GTPase ARF6 [ARF6(T27N)] in cultured adipocytes selectively inhibited both F-actin formation and GLUT4 translocation in response to endothelin 1 but not insulin. These data indicate that ARF6 is a required downstream element in endothelin 1 signaling through G(alpha)11 to regulate cortical actin and GLUT4 translocation in cultured adipocytes, while insulin action involves different signaling pathways.


Figures

FIG. 1
FIG. 1
Expression of Gαq and Gα11 in various rat tissues. Rat tissue extracts were prepared from brain (B), kidney (K), liver (L), lungs (Lu), heart (H), fat (F), skeletal muscle (M), 3T3 L1 fibroblasts (Fib), and adipocytes (Adip); 25-μg aliquots of the extracts were resolved by SDS-PAGE on 10% gels, electrophoretically transferred to nitrocellulose, blocked, and subsequently incubated with Gαq- or Gα11-specific antibodies as described in Materials and Methods.
FIG. 2
FIG. 2
Stimulated GLUT4 levels in plasma membrane lawns of 3T3-L1 adipocytes expressing Gα11(Q209L) is not affected by wortmannin. 3T3-L1 adipocytes were infected with control (CON; A to C) or Gα11(Q209L)-expressing (D and E) adenoviruses as described in Materials and Methods. Overnight serum-starved cells were either untreated (A and D), stimulated with 100 nM insulin for 30 min (B), or treated with 100 nM wortmannin followed by stimulation with 100 nM insulin (C) and 100 nM wortmannin (E) alone for 45 min. The cells were then sonicated, and plasma membrane lawns were fixed and stained for total membranes (red) and GLUT4 (green). The data reflects results from five separate experiments.
FIG. 3
FIG. 3
Luminosity ratio of GLUT4 to total membrane signals in plasma membrane lawns of recombinant adenovirus-infected 3T3-L1 adipocytes, quantified using Adobe Photoshop 5.0.2. The ratio of the luminosity of the GLUT4 lawns (green) to the luminosity of the corresponding lawn stained with WGA-rhodamine (red) was calculated for each condition and plotted. The average values were calculated from at least 10 data points from five different experiments.
FIG. 4
FIG. 4
Gα11(Q209L) stimulation of 2-deoxyglucose uptake in differentiated 3T3-L1 adipocytes is wortmannin independent. Differentiated 3T3-L1 adipocytes seeded at 150,000/well in 24-well plates were infected with either control or Gα11(Q209L)-expressing adenoviruses. The cells were serum starved for 2 h in Krebs-Ringer phosphate buffer with BSA and pyruvate. The control virus-infected cells were then stimulated with either 100 nM insulin or 10 nM endothelin 1 (ET-1) alone for 30 min or following treatment of the cells with 100 nM wortmannin for 15 min. The cells that were infected with Gα11(Q209L)-expressing adenoviruses were either left untreated or treated with 100 nM wortmannin for 45 min. They were then assayed for 2-deoxyglucose (2-DOG) uptake as described in Materials and Methods. The data represents the average of four separate experiments with each condition tested in triplicate.
FIG. 5
FIG. 5
F-actin staining in differentiated 3T3-L1 adipocytes transfected with HA-Gα11(Q209L). 3T3-L1 adipocytes were electroporated with pCMV5-HA-Gα11(Q209L) as described in Materials and Methods. The cells were then fixed and stained with anti-HA-FITC and rhodamine-phalloidin to identify transfected cells and visualize F-actin, respectively. The Gα11(Q209L)-transfected cells were identified by staining the cells with anti-HA antibodies. Untransfected adipocytes are indicated by arrowheads. Each panel represents a separate field from a representative experiment.
FIG. 6
FIG. 6
F-actin rearrangements in 3T3-L1 adipocytes by insulin, endothelin 1, and Gα11(Q209L). 3T3-L1 adipocytes were serum starved and either left untreated (A) or stimulated with 100 nM insulin (B) and 100 nM endothelin 1 (ET-1; C) for 30 min. Samples were fixed, permeabilized, and stained with rhodamine-phalloidin as described in the text. Images were acquired by focusing at the bottom of the cells with an Olympus IX-70 inverted microscope and the Metamorph software (Universal Imaging). 3T3-L1 adipocytes that were transfected with HA-Gα11(Q209L) were fixed and permeabilized following serum starvation. They were then stained with anti-HA-FITC for identifying electroporated cells (D) and rhodamine-phalloidin to visualize F-actin.
FIG. 7
FIG. 7
Effects of nocodazole and latrunculin B on insulin and Gα11(Q209L)-induced GLUT4 translocation in differentiated 3T3-L1 adipocytes. 3T3-L1 adipocytes differentiated in six-well plates were infected with either control or Gα11(Q209L)-expressing adenovirus as described in Materials and Methods, treated with either nocodazole (N) or latrunculin B (L) alone or in combination (N + L) for 1 h, and stimulated with insulin (I) for 10 min. The plasma membrane lawns were then prepared and stained for GLUT4 (green) and total membranes (red). The data reflect results from four different experiments.
FIG. 8
FIG. 8
Luminosity ratio of GLUT4 to total membrane signals in plasma membrane lawns of nocodazole and latrunculin B-treated 3T3-L1 adipocytes. The total luminescence of the FITC signal (GLUT4) and the rhodamine signal (total membranes) from the plasma membrane lawns was calculated and plotted as in Fig. 4. The data represent the average of four separate experiments.
FIG. 9
FIG. 9
Cortical F-actin formation in response to endothelin 1 but not insulin is inhibited in 3T3-L1 adipocytes transfected with HA-ARF6(T27N). Differentiated 3T3-L1 adipocytes were transfected with pCMV5-HA-Arf6(T27N) by electroporation, left untreated or treated with 100 nM insulin or 10 nM endothelin 1 for 30 min, and then fixed and stained with anti-HA-FITC and rhodamine-phalloidin to identify transfected cells and visualize F-actin, respectively (top). The graph shows the percentage of untransfected or transfected cells that displayed cortical actin staining in response to insulin and endothelin 1 (ET-1) (average of five separate experiments).
FIG. 10
FIG. 10
Dominant negative ARF6(T27N) inhibits 2-deoxyglucose uptake stimulated by endothelin 1 but not by insulin in 3T3-L1 adipoctes. Differentiated 3T3-L1 adipoctes were infected with ARF6(T27N)-expressing adenoviruses as described in the text. After serum starvation, the cells were treated with insulin or endothelin 1 (ET-1) for 30 min and then assayed for 2-deoxyglucose (2-DOG) uptake as described in the text. The data represents the average of four separate experiments.
FIG. 11
FIG. 11
Dominant negative ARF6(T27N) inhibits GLUT4 translocation stimulated by endothelin 1 but not GLUT4 translocation stimulated by insulin. Differentiated 3T3-L1 adipocytes were transfected with GFP-GLUT4 alone (A) or with HA-ARF6(T27N) (B) by electroporation. After 48 h, the cells were serum starved for 4 h and then treated with either 100 nM insulin for 45 min or 10 nM endothelin 1 for 30 min. The cells were then fixed and stained with anti-HA antibody followed by rhodamine-conjugated secondary antibody to detect HA-ARF6(T27N)-transfected cells. The data represent four separate experiments.

References

    1. Al-Anwar O, Radhakrishna H, Donaldson J G. Separation of membrane trafficking and actin remodeling functions of ARF6 with an effector domain mutant. Mol Cell Biol. 2000;20:5998–6007. - PMC - PubMed
    1. Amatruda T, Steele D, Slepak V, Simon M I. G alpha 16, a G protein alpha subunit specifically expressed in hematopoietic cells. Proc Natl Acad Sci USA. 1991;88:5587–5591. - PMC - PubMed
    1. Baldini G, Hohman R, Charron M J, Lodish H F. Insulin and nonhydrolyzable GTP analogs induce translocation of GLUT 4 to the plasma membrane in alpha-toxin-permeabilized rat adipose cells. J Biol Chem. 1991;266:4037–4040. - PubMed
    1. Baumann C A, Ribon V, Kanzaki M, Thurmond D C, Mora S, Shigematsu S, Bickel P E, Pessin J E, Saltiel A R. CAP defines a second signalling pathway required for insulin-stimulated glucose transport. Nature. 2000;407:202–207. - PubMed
    1. Berridge M J. Inositol trisphosphate and calcium signalling. Nature. 1993;361:315–325. - PubMed

Publication types

MeSH terms

Substances

LinkOut - more resources