. 2001 Jul 17;98(15):8862-7.
doi: 10.1073/pnas.141244998. Epub 2001 Jul 3.

Genome-wide gene expression profiles of the developing mouse hippocampus

Affiliations

Genome-wide gene expression profiles of the developing mouse hippocampus

M Mody et al. Proc Natl Acad Sci U S A. .

Abstract

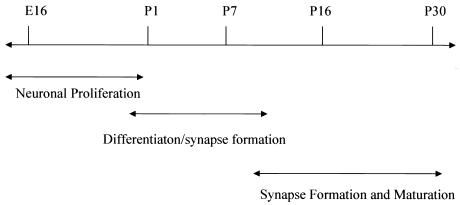
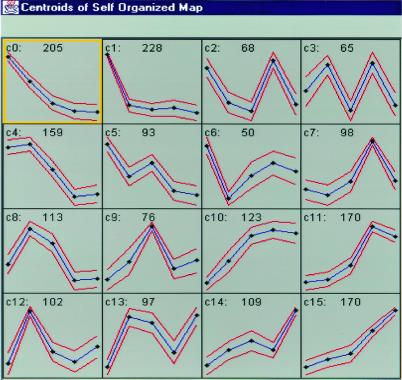
We have analyzed the developmental molecular programs of the mouse hippocampus, a cortical structure critical for learning and memory, by means of large-scale DNA microarray techniques. Of 11,000 genes and expressed sequence tags examined, 1,926 showed dynamic changes during hippocampal development from embryonic day 16 to postnatal day 30. Gene-cluster analysis was used to group these genes into 16 distinct clusters with striking patterns that appear to correlate with major developmental hallmarks and cellular events. These include genes involved in neuronal proliferation, differentiation, and synapse formation. A complete list of the transcriptional changes has been compiled into a comprehensive gene profile database (http://BrainGenomics.Princeton.edu), which should prove valuable in advancing our understanding of the molecular and genetic programs underlying both the development and the functions of the mammalian brain.


Figures

Figure 1
Figure 1
Dissection time line of the developing mouse hippocampus. The arrows illustrate one example of the peak windows for the major neuronal events occurring during the hippocampal development.
Figure 2
Figure 2
Reproducibility of the genes identified by the microarray technology. (a) Reproducibility of the data obtained from the GeneChip array study. The green dots represent the genes detected in both P1 samples, an estimated 34% of the genes on a single chip. The yellow or blue dots represent the genes detected only in one of the samples, and thus these signals only constitute about 0.25–0.3% of the genes on the chip. (b) Differential gene expression between P1 and P30. An intensity of 400 to 500 corresponds to approximately one copy per cell. The axes represent gene expression intensity. The green dots represent the genes detected in both P1 and P30. The yellow dots represent the genes detected in P1, but not P30. Similarly, the blue dots represent the genes detected in the P30 sample, but not in P1. Five percent of probe sets showed more than 3-fold changes.
Figure 3
Figure 3
Cluster analysis of probes sets on mouse 11,000 arrays. Self-organizing maps (SOM) were used to group the 4,390 identified genes and ESTs into clusters based on similar expression dynamics over the five time point. Analysis algorithms were used to convert raw data into expression data for these genes before applying SOM analysis. The label at the upper-left corn of each inset represents cluster number (from c0–c15). The number in the top center of each inset represents the number of genes in that particular cluster. The five dots in each inset represent the five developmental time points (E16, P1, P7, P16, and P30).
Figure 4
Figure 4
Biochemical pathway of glycolysis. In Type II clusters (primarily in the c15 of SOM), all of the major enzymes involved in glycolysis were identified by gene-cluster analysis. This observation not only validates the approach, but also fits nicely with the well known fact that the energy utilization of the mammalian brain switches from ketone in neonatal stages to glucose at more mature stages. The genes identified from gene-cluster analysis are shown as marked in yellow.

References

    1. Squire L R. Memory and Brain. New York: Oxford Univ. Press; 1997.
    1. O'keefe J, Nadel L. The Hippocampus as a Cognitive Map. Oxford: Clarendon; 1978.
    1. Cohen N J, Eichenbaum H. Memory, Amnesia, and Hippocampal System. Cambridge, MA: MIT Press; 1993.
    1. Bear M F, Malenka R L. Curr Opin Neurobiol. 1994;4:389–399. - PubMed
    1. Bliss T V P, Collingridge G L. Nature (London) 1993;361:31–39. - PubMed

Publication types

LinkOut - more resources