. 2001 Jul 17;98(15):8891-6.
doi: 10.1073/pnas.151339598. Epub 2001 Jul 3.

Folliculostellate cell network: a route for long-distance communication in the anterior pituitary

Affiliations

Folliculostellate cell network: a route for long-distance communication in the anterior pituitary

T Fauquier et al. Proc Natl Acad Sci U S A. .

Abstract

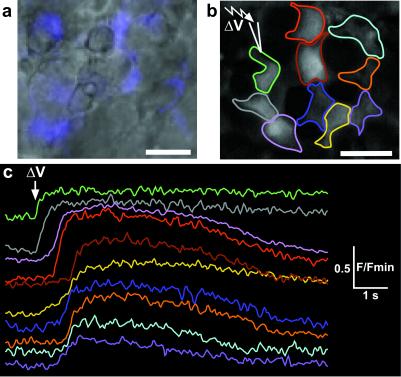
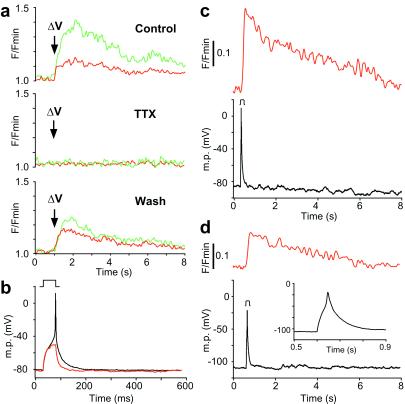
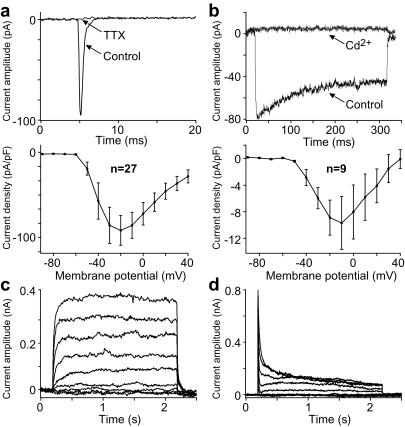
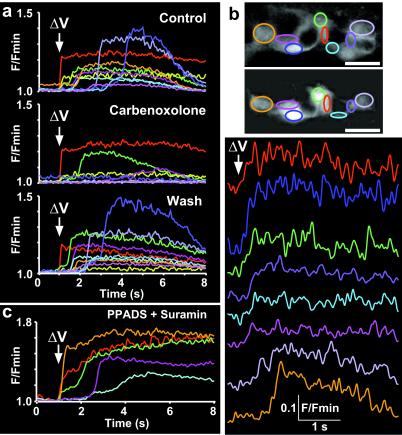
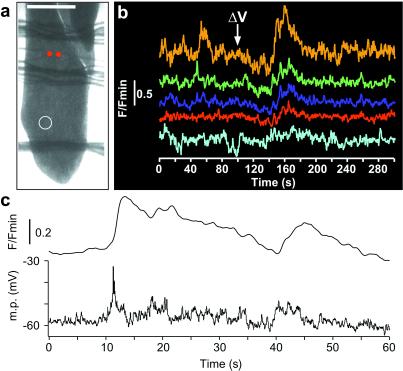
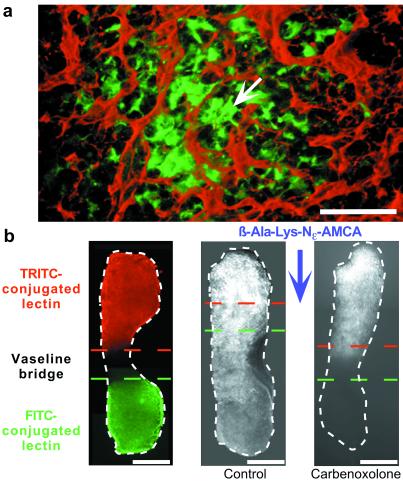
All higher life forms critically depend on hormones being rhythmically released by the anterior pituitary. The proper functioning of this master gland is dynamically controlled by a complex set of regulatory mechanisms that ultimately determine the fine tuning of the excitable endocrine cells, all of them heterogeneously distributed throughout the gland. Here, we provide evidence for an intrapituitary communication system by which information is transferred via the network of nonendocrine folliculostellate (FS) cells. Local electrical stimulation of FS cells in acute pituitary slices triggered cytosolic calcium waves, which propagated to other FS cells by signaling through gap junctions. Calcium wave initiation was because of the membrane excitability of FS cells, hitherto classified as silent cells. FS cell coupling could relay information between opposite regions of the gland. Because FS cells respond to central and peripheral stimuli and dialogue with endocrine cells, the form of large-scale intrapituitary communication described here may provide an efficient mechanism that orchestrates anterior pituitary functioning in response to physiological needs.


Figures

Figure 1
Figure 1
Generation of propagated [Ca2+]i waves in FS cells in response to electrical stimulation. (a) Superimposed differential interference contrast microscopy image of the slice surface with β-Ala-Lys-Nɛ-AMCA fluorescence (pseudocolored in blue) of FS cells (scale bar, 10 μm). (b) A confocal image showing 10 FS cells loaded with a fluorescent Ca2+ dye (scale bar, 10 μm). The color circles highlight the area of each cell used to monitor changes in fluorescence reflecting [Ca2+]i levels. The stimulating micropipette was touching the cell circled in green. (c) Changes in fluorescence, normalized to baseline fluorescence (F/Fmin), for the 10 regions in b. The spread of a [Ca2+]i wave was initiated by a brief electrical stimulation. Onset of the stimulation is indicated by an arrow.
Figure 2
Figure 2
Generation of [Ca2+]i transients depends on membrane excitability. (a) Stimulated [Ca2+]i transients in two adjoining FS cells (red trace: triggered cell) in normal Ringer's saline (Top) and in the presence of 0.5 μM TTX (Middle) are shown. (Bottom) The TTX-mediated alteration of [Ca2+]i transients recovered after a 12-min wash. (b) Step current injection triggered an all-or-none action potential (black trace), which was suppressed in the presence of 0.5 μM TTX (red trace). (c) Current-clamp recording of a single action potential triggered upon current step (Lower) that caused a transient rise in [Ca2+]i (Upper). (d) Similar combined electrical and optical recordings in a TTX-treated cell. (Inset) The TTX-resistant spike on expanded time scale.
Figure 3
Figure 3
Voltage-gated currents in FS cells. Voltage-clamp recordings were carried out in FS cells (holding potential = −80 mV). (a Upper) Inward current triggered upon step depolarization. TTX (0.5 μM) blocked the inward current. (Lower) Relative current-voltage relationship of the peak inward current (mean ± SEM). (b Upper) Inward current carried by Ba2+ ions (in the presence of TTX) and triggered upon depolarization to −20 mV. Cd2+ ions (500 μM) suppressed the Ba2+ current. (Lower) Relative current–voltage relationship of peak Ba2+ current. (c) Outward currents triggered upon a series of voltage steps (−80 to +80 mV, 20-mV increment). (d) Similar recordings in another cell treated with 15 mM TEA.
Figure 4
Figure 4
Propagation of [Ca2+]i waves between FS cells depends on gap junctional signaling. (a) Electrically stimulated [Ca2+]i waves between FS cells (red trace: triggered cell) in normal Ringer's saline (Top) and in the presence of 100 μM carbenoxolone (Middle) are shown. Carbenoxolone reduced the number of FS cells propagating the [Ca2+]i wave in a reversible manner (Bottom). (b Top) Field of FS cells loaded with the Ca2+-sensitive dye (cell circled in red: stimulated cell). (Middle) Lucifer yellow-filled cells after the patch-clamp recording of the stimulated cell (scale bar, 5 μm). (Bottom) [Ca2+]i wave triggered in response to voltage stimulation in the FS cells that subsequently showed Lucifer yellow diffusion. (c) Pyridoxal phosphate-6-azophenyl-2′,4′-disulfonic acid + suramin (100 μM each), antagonists of purinergic receptors, failed to suppress a propagated [Ca2+]i wave in response to voltage stimulation.
Figure 5
Figure 5
Long-distance propagation of electrical and Ca2+ signals along the FS cell circuit. (a) Bright-field image of a coronal pituitary slice. The irregular transverse lines were the nylon threads used to keep the slice in place. The two red dots help identify the position of the two stimulation pipette tips touching the slice surface. (Scale bar, 500 μm.) (b) [Ca2+]i changes were recorded (5 frames per s) in five FS cells that were located in the region delimited by the white circle (620 μm from the pair of stimulation pipettes) in a. Electrical stimulation (700 μA, 75 ms) induced the occurrence of coincident [Ca2+]i rises in these cells. (c) In another slice, electrical and [Ca2+]i recordings were simultaneously combined in an FS cell, 520 μm away from the point of stimulation. [Ca2+]i rise did not occur, neither did depolarization between the electrical stimulation and the beginning of the plots (39-s time span). Transient depolarizing events then coincided with the propagated [Ca2+]i rises.
Figure 6
Figure 6
Three-dimensional, large-scale communication through the FS cell network. (a) Three-dimensional reconstruction (20-μm depth) of Neurobiotin-filled FS cells (labeled in green) together with the immunolabeling of laminin, a component of basal laminae surrounding the cell cords (labeled in red). The arrow indicates the approximate location of the cell initially recorded during 90 min with a Neurobiotin-containing patch-clamp pipette (scale bar, 50 μm). (b) FS cell network visualized with the Vaseline-gap technique. (Left) Coronal slice straddling between two compartments of a chamber. Fluorescent lectin stainings localized the Vaseline bridge covering the slice at the compartment interface (scale bar, 500 μm). TRITC, tetramethylrhodamine isothiocyanate. Colored dashed lines delineate the approximate location of the Vaseline bridge, whereas the white one shows the slice periphery. (Center) Bath application of β-Ala-Lys-Nɛ-AMCA in the top compartment allowed the staining of FS cells across the whole slice. (Right) When carbenoxolone (100 μM) was present in both compartments, β-Ala-Lys-Nɛ-AMCA-stained FS cells were seen only in the top compartment and, marginally, within the Vaseline gap.

References

    1. Knobil E. Recent Prog Horm Res. 1980;36:53–88. - PubMed
    1. Liu J H, Kazer R R, Rasmussen D D. J Clin Endocrinol Metab. 1987;64:1027–1035. - PubMed
    1. Sassin J F, Frantz A G, Weitzman E D, Kapen S. Science. 1972;177:1205–1207. - PubMed
    1. Plotsky P M, Vale W. Science. 1985;230:461–463. - PubMed
    1. Porter J C, Ondo J G, Cramer O M. Handb Physiol Sect Endocrinol. 1974;4:33–43.

Publication types

LinkOut - more resources