. 2001 Jul 17;98(15):8614-9.
doi: 10.1073/pnas.151588598. Epub 2001 Jul 3.

Intrinsic noise in gene regulatory networks

Affiliations

Intrinsic noise in gene regulatory networks

M Thattai et al. Proc Natl Acad Sci U S A. .

Abstract

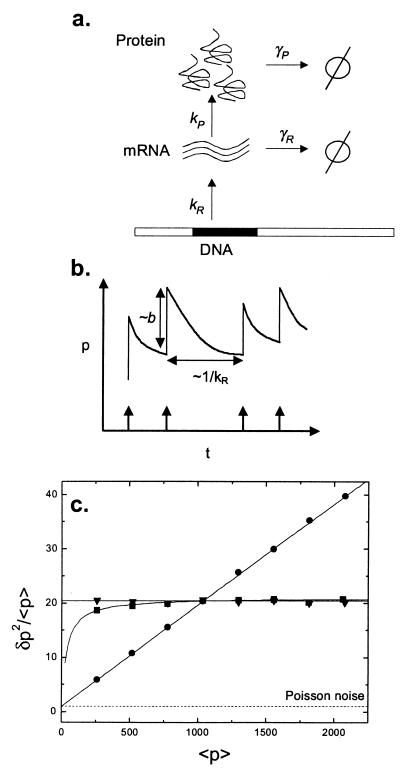
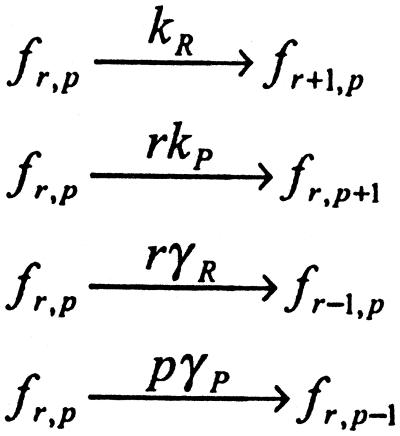
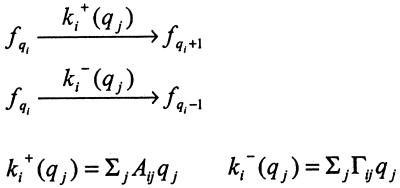
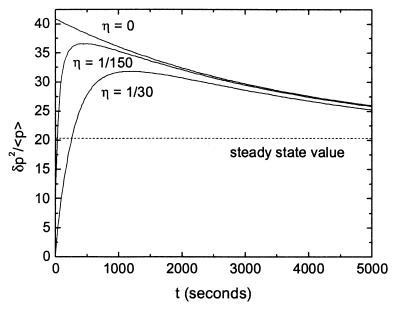
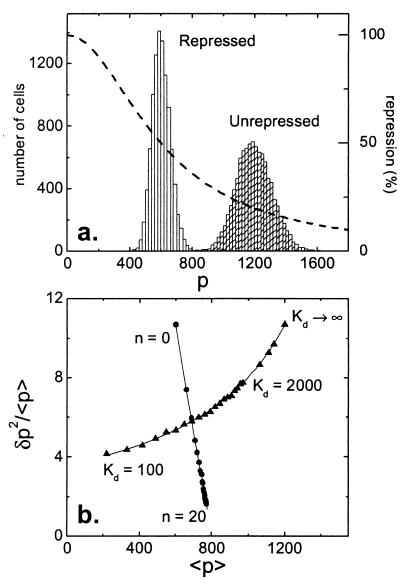
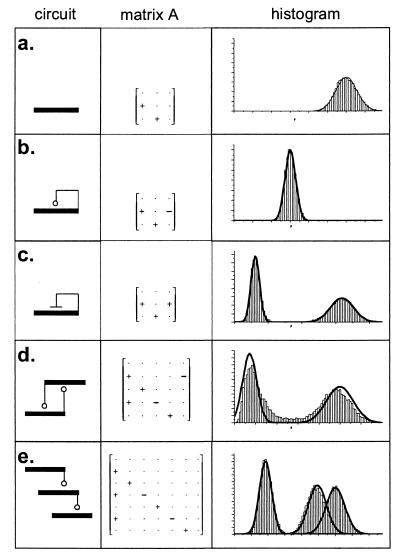
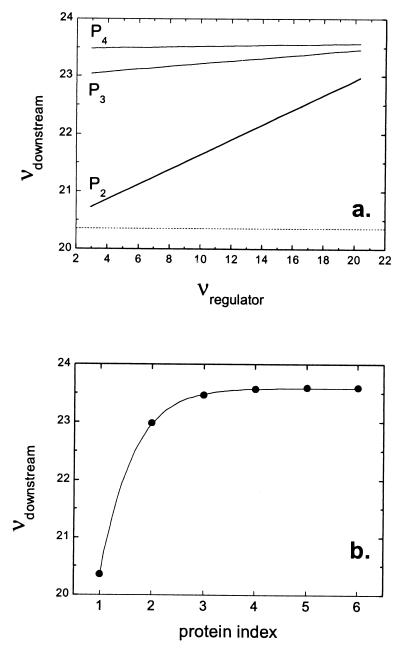
Cells are intrinsically noisy biochemical reactors: low reactant numbers can lead to significant statistical fluctuations in molecule numbers and reaction rates. Here we use an analytic model to investigate the emergent noise properties of genetic systems. We find for a single gene that noise is essentially determined at the translational level, and that the mean and variance of protein concentration can be independently controlled. The noise strength immediately following single gene induction is almost twice the final steady-state value. We find that fluctuations in the concentrations of a regulatory protein can propagate through a genetic cascade; translational noise control could explain the inefficient translation rates observed for genes encoding such regulatory proteins. For an autoregulatory protein, we demonstrate that negative feedback efficiently decreases system noise. The model can be used to predict the noise characteristics of networks of arbitrary connectivity. The general procedure is further illustrated for an autocatalytic protein and a bistable genetic switch. The analysis of intrinsic noise reveals biological roles of gene network structures and can lead to a deeper understanding of their evolutionary origin.


Figures

Figure 1
Figure 1
Modeling single gene expression. (a) mRNA molecules are synthesized at rate kR from the template DNA strand. Proteins are translated at a rate kP off each mRNA molecule. Proteins and mRNA degrade at rates γP and γR, respectively. Degradation into constituents is denoted by φ. All reactions are assumed to be Poisson, so that the probability of a reaction with rate k happening in a time dt is given by kdt, and the waiting times between successive reactions are exponentially distributed. (b) A simplified timecourse illustrates the intuition behind the result of Eq. 1. Transcription initiation events occur with average frequency kR and are indicated by arrows; each mRNA transcript releases a burst of proteins of average size b, and proteins decay between bursts. (c) Controlling mean and variance of protein number by varying system parameters for single gene expression. The Fano factor ratio (δp2/<p> ≡ variance/mean) is plotted versus the mean. The mRNA half-life is fixed at 2 min. The base case corresponds to a burst size b = 20, a transcript initiation rate kR = 0.01 s−1 and a protein half-life ln(2)/γP = 1 h. The three curves are produced by varying one of these parameters while keeping the other two fixed. b is varied between 5 and 40 (circles); kR is varied between 0.0025 s−1 and 0.02 s−1 (triangles); protein half-life is varied from 15 min to 2 h (squares). The Poisson value of δp2/<p> = 1 is marked for comparison. Monte Carlo results (symbols) match analytic values given by Eq. 1 exactly (solid lines).
Scheme 1
Scheme 1
Scheme 2
Scheme 2
Figure 2
Figure 2
Transient noise for a single gene. The protein half-life is fixed at 1 h, b = 20, and kR = 0.01 s−1. Exact analytic results are plotted for an mRNA half-life of 120, 24, and 0 s, corresponding to η = 1/30, 1/150, and 0, respectively. δp2/<p> is plotted versus time in seconds. The η = 0 case corresponds to Eq. 2; the steady-state value from Eq. 1 is shown as a dashed line. The transient noise reaches almost twice the steady-state strength, as η tends to zero.
Figure 3
Figure 3
Noise control by autoregulation. (a) The histogram (scale on left axis) to the right shows the unrepressed distribution, the one to the left the distribution when repression is turned on. The rate of protein production at any given protein number p is given by a Hill repression function (dashed line, scale on right axis): kR/kformula image=1/(1+[p/Kd]”). Here, Kd is the dissociation constant that specifies the threshold protein concentration at which the transcription rate is at half its maximum value. n is the Hill coefficient and determines the steepness of the repression curve. For example, the cI repressor protein acts on the promoters PR and PRM of phage λ with a Kd of about 50 and 1,000 nM, respectively (26). Typical biological values for n range from 1 (hyperbolic control) to over 30 (sharp switching). Note that the repression curve is very nearly linear in the region where it intersects the repressed histogram. (b) Noise control by autoregulation: comparing analytic results (solid lines, Eq. 3) with Monte Carlo simulations, as Kd is varied (triangles), and n is varied (circles). As in Fig. 1c, the Fano factor (variance/mean) is plotted versus the mean. The protein half-life is fixed at 1 h, mRNA half-life at 2 min, and the burst size at 10; the unrepressed mean value is <p>unrep = 1,200. Note that n = 0 corresponds to a fixed transcription initiation rate that is half the base value, therefore giving a mean protein number of 600. Kd is varied (triangles) from 100 to 2,000 in increments of 100, and then from 2,000 to 5,000 in increments of 1,000, with n set to 2. (Kd is given in molecule number; one molecule per cell corresponds to a concentration of ≈1 nanomolar.) The unrepressed (Kd is infinite) limit is also shown. n is varied (circles) from 0 to 20, with Kd set at 800. The Monte Carlo simulations (symbols) are very well reproduced by the analytical values (solid lines) given by Eq. 3.
Figure 4
Figure 4
Analysis of various gene regulatory networks. (a) Single gene. (b) Autoregulatory protein. Parameters are the same as in a but with repression turned on. (c) Autocatalytic protein. Both steady states are shown. (d) Bistable switch with two mutually repressing proteins. This system occasionally makes a transition from one steady state to the other, leading to a shallow valley between the two peaks not predicted by the analytic model. (e) Feed-forward cascade of three genes. A histogram is shown for each protein. In each case, the network is represented schematically and the network matrix A is shown (with entries + or − showing the sign of each quantity). The matrix Γ is omitted because it is always diagonal. The results from a typical Monte Carlo simulation of the network are shown. The numerical histograms for protein number are overlaid with Gaussians (solid lines), with the mean and variance predicted by the analytic model.
Figure 5
Figure 5
Propagation of noise in a regulatory cascade. Analytic results are shown for a six gene cascade with gene products P1, P2 … P6 (similar to Fig. 4e). As described below, mean values of all proteins are fixed so that effects purely caused by propagated noise can be seen. P1 is the regulator protein, P2 … P6 are downstream proteins, and i is the protein index of Pi. For all six genes, ln(2)/γP = 1 h, ln(2)/γR = 2 min. The transcript initiation rate of downstream genes depends hyperbolically on the amount of protein in the previous step of the cascade: kRi/kformula image = 1 − 1/(1 + pi−1/Kd) with K = 500. As in previous figures, we focus on the Fano factor ν = δp2/<P>. (a) For the regulator gene, b is varied from 0 to 20, thereby changing the variance of P1 (Eq. 1); for downstream genes, b = 20. formula image and formula image are chosen so that Pi = Kd for all i. ν(P2) … ν(P4) are plotted against ν(P1). (Data for i = 5, 6 are difficult to distinguish from those for i = 4.) The predicted value of ν for a burst size b = 20 in the absence of input noise (Eq. 1) is shown as a dashed line. The results indicate that fluctuations in the concentration of a regulatory protein are an important source of noise in a cascade. (b) Now b is fixed at 20 for all genes, and parameters are again chosen so Pi = Kd for all i. ν(Pi) is shown as a function of protein index i. For visual clarity, the results are fitted to a hyperbola. We see that propagated noise makes a significant contribution to the noise of downstream proteins, although saturating after a few steps of the cascade.

References

    1. McAdams H H, Arkin A. Trends Genet. 1999;15:65–69. - PubMed
    1. Arkin A, Ross J, McAdams H H. Genetics. 1998;149:1633–1648. - PMC - PubMed
    1. van de Putte P, Goosen N. Trends Genet. 1992;8:457–462. - PubMed
    1. von Dassow G, Meir E, Munro E M, Odell G M. Nature (London) 2000;406:188–192. - PubMed
    1. Ko M S H. J Theor Biol. 1991;153:181–194. - PubMed

LinkOut - more resources