. 2001 Jul 3;98(14):7684-9.
doi: 10.1073/pnas.121069998.

Functional dynamics in the active site of the ribonuclease binase

Affiliations

Functional dynamics in the active site of the ribonuclease binase

L Wang et al. Proc Natl Acad Sci U S A. .

Abstract

Binase, a member of a family of microbial guanyl-specific ribonucleases, catalyzes the endonucleotic cleavage of single-stranded RNA. It shares 82% amino acid identity with the well-studied protein barnase. We used NMR spectroscopy to study the millisecond dynamics of this small enzyme, using several methods including the measurement of residual dipolar couplings in solution. Our data show that the active site of binase is flanked by loops that are flexible at the 300-micros time scale. One of the catalytic residues, His-101, is located on such a flexible loop. In contrast, the other catalytic residue, Glu-72, is located on a beta-sheet, and is static. The residues Phe-55, part of the guanine base recognition site, and Tyr-102, stabilizing the base, are the most dynamic. Our findings suggest that binase possesses an active site that has a well-defined bottom, but which has sides that are flexible to facilitate substrate access/egress, and to deliver one of the catalytic residues. The motion in these loops does not change on complexation with the inhibitor d(CGAG) and compares well with the maximum k(cat) (1,500 s(-1)) of these ribonucleases. This observation indicates that the NMR-measured loop motions reflect the opening necessary for product release, which is apparently rate limiting for the overall turnover.


Figures
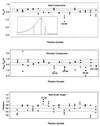
Figure 1
Figure 1
Examples of Saupe order tensor elements in binase. The filled gray circles represent the flanks of the distribution corresponding to the half maximum height. The filled black circles represent the optimal values corresponding to the maximum heights of the distribution. Three dashed lines denote their average values over the entire protein sequence. These two flanking lines define the confidence limit. The numbers indicate the stretch (quintet) having the tensor values outside the confidence limits. (Top Inset) An example of a non-Gaussian distribution for quintet 102–106. Three vertical lines in the Inset indicate the maximum and its half heights. The x axes indicate the residue quintets used to calculate the tensor whereas the y axes indicate their corresponding values, for the top two panels in units of normalized order parameters (i.e., in units of the global ordering KNHFformula image).
Figure 2
Figure 2
(a) Conformational exchange in binase. The x axis indicates the amino acid sequence; elements of secondary structure are also indicated. The open triangles and filled diamonds give the 15N R2 relaxation rate with and without a CPMG sequence, respectively. Large values of R2 indicate conformational exchange broadening, caused by molecular motions at the ms-μs time scale. (b) Amide proton/deuterium exchange. A sample of 0.5 mM of 15N-labeled binase was lyophilized and dissolved in D2O. 15N–1H HSQC spectra were recorded with a repetition rate of 22 min. The open stars, open diamonds, and filled triangles give the fast, intermediate, and slow hydrogen exchange rates, respectively. The fastest exchange rate that could be measured was 22 min−1; the slowest 96 h. Fast exchange indicates exposure/mobility. (c) Saupe tensor parameters, derived from residual 15N–1H dipolar coupling parameters in binase, that deviate significantly from the average values, indicating either static or dynamic deviation of the solution conformation from the x-ray structure. Solid lines represent the axial and rhombic components whereas the dashed lines give the Euler angle beta. The numbers above these lines indicate the stretch where the five residues (quintets) are located.
Figure 3
Figure 3
(A) The crystal structure of binase (18) encoded with the 15N conformational exchange data obtained at 11.7 T (500 MHz 1H). The width of the tube representing the backbone indicates the amount of conformational exchange broadening. The color coding is as follows: gray, no data; blue Rex < 0.5 s−1; orange, 0.5 s−1 < Rex < 1.5 s−1; red and yellow, Rex > 1.5 s−1. The yellow coding indicates that the conformational exchange broadening for the β-strands β3 and β4 may be induced by the flexible loops hovering above it (see text). The side-chains of residues inferred to interact with substrate/inhibitor (see Fig. 3b) are indicated in green; the catalytic residues Glu-71 and His-101 in pink. (B) The crystal structure of barnase complexed with dC-G-A-C (PDB accession code 1BRN; ref. 30) in the same orientation. The DNA is in cyan; the active site residues that interact with this inhibitor are in green, the catalytic residues Glu-72 and His-102 are in pink (the barnase count deviates by one from binase for all these residues because of an insertion at the second residue). The figure was prepared with molmol (18).

References

    1. Fersht A. Structure and Mechanism in Protein Science. New York: Freeman; 1999. p. 51.
    1. Ishima R, Torchia D A. Nat Struct Biol. 2000;7:740–743. - PubMed
    1. Yakovlev G I, Moiseyev G P, Struminskaya N K, Borzykh O A, Kipenskaya L V, Znamenskaya L V, Leschinskaya I B, Chernokalskaya E B, Hartley R W. FEBS Lett. 1994;354:305–306. - PubMed
    1. Meiering E M, Serrano L, Fersht A R. J Mol Biol. 1992;225:585–589. - PubMed
    1. Carrington A, McLachlan A. Introduction to Magnetic Resonance with Applications to Chemistry and Chemical Physics. New York: Harper & Row; 1967.

Publication types

MeSH terms

LinkOut - more resources