. 2001 Jul 3;98(14):7771-6.
doi: 10.1073/pnas.131477798.

Configurational diffusion down a folding funnel describes the dynamics of DNA hairpins

Affiliations

Configurational diffusion down a folding funnel describes the dynamics of DNA hairpins

A Ansari et al. Proc Natl Acad Sci U S A. .

Abstract

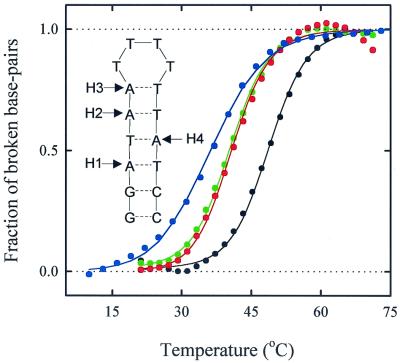
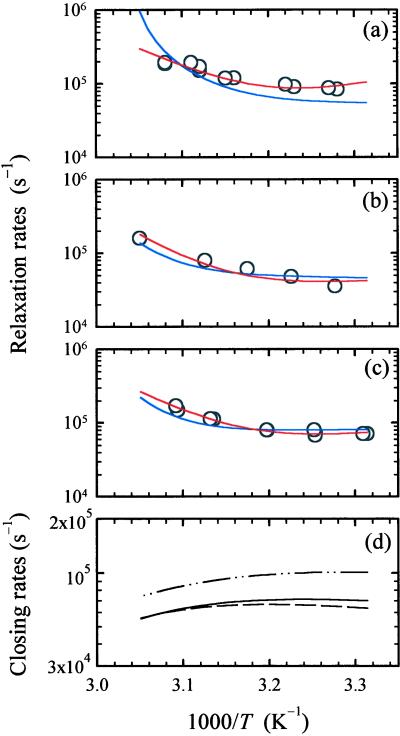
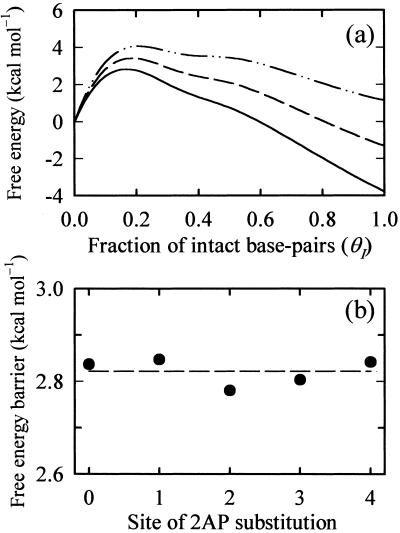
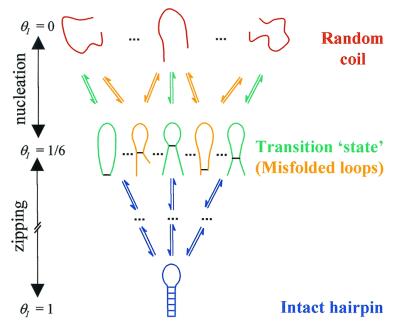
Elucidating the mechanism of folding of polynucleotides depends on accurate estimates of free energy surfaces and a quantitative description of the kinetics of structure formation. Here, the kinetics of hairpin formation in single-stranded DNA are measured after a laser temperature jump. The kinetics are modeled as configurational diffusion on a free energy surface obtained from a statistical mechanical description of equilibrium melting profiles. The effective diffusion coefficient is found to be strongly temperature-dependent in the nucleation step as a result of formation of misfolded loops that do not lead to subsequent zipping. This simple system exhibits many of the features predicted from theoretical studies of protein folding, including a funnel-like energy surface with many folding pathways, trapping in misfolded conformations, and non-Arrhenius folding rates.


Figures

Figure 1
Figure 1
The hairpin sequence used in this study and its melting profiles. 2AP was substituted for A at the sites indicated on the hairpin. H1: substitution at site 1 only; H2: substitution at site 2 only, etc. H0 is the hairpin with no substitution; (black): melting profile of H0 from absorbance at 266 nm; (green): melting profile of H1 from absorbance at 266 nm; (red): melting profile of H1 from absorbance at 330 nm (where 2AP absorbs); (blue): melting profile of H1 from fluorescence of 2AP. The symbols are the data; the corresponding lines through the absorbance data are fits to a statistical mechanical “zipper” model; the line through the fluorescence data is a two-state van't Hoff fit. All melting profiles have been normalized by subtracting the Upper and Lower baselines determined from a fit to the raw data.
Figure 2
Figure 2
Kinetics of unwinding/hairpin formation. The fluorescence of 2AP substituted at site 1 (hairpin H1) is monitored as a function of time following a laser temperature jump from 29 to 37°C. The characteristic relaxation rate kr obtained from a single exponential fit to the data is 1/(10.5 μs) at 37°C. The amplitude of the fluorescence extrapolated to zero time is smaller than the prelaser fluorescence as a result of a rapid decrease in the quantum yield of 2AP on change in temperature.
Figure 3
Figure 3
Arrhenius plots of the relaxation rates (kr) and closing rates (kc). (ac) The relaxation rates kr versus inverse temperature for hairpins with 2AP substitution at (a) site 1 (H1), (b) site 2 (H2), and (c) site 3 (H3), respectively. The circles are the measured relaxation rates. Red curves: fit to a two-state model with Arrhenius temperature dependence. The prefactors for the rate of hairpin formation (Eq. 1) are kc0 = 1.2 × 10⁵ s−1, 0.4 × 10⁵ s−1, 0.8 × 10⁵ s−1 (at T0 = 25°C), and the apparent activation energies are Ea = −16.2 kcal mol−1, −7.3 kcal mol−1, −9.5 kcal mol−1 for the hairpins H1, H2, and H3, respectively. Blue curves: fit to the diffusion model. The fitting parameters are D0 = 2.1 × 10⁵ s−1, 1.9 × 10⁵ s−1, and 2.9 × 10⁵ s−1 (at T0 = 25°) for H1, H2, and H3, respectively, and ΔE = 0.98 kcal mol−1. (d) Hairpin closing rates kc calculated from the diffusion model (Eq. 3) for H1 (continuous line), H2 (dashed line), and H3 (dash-dot-dot line).
Figure 4
Figure 4
The free energy landscape for hairpin formation. (a) The free energy profiles for the hairpin with no 2AP substitution are plotted versus the fraction of intact base pairs (θI), at three temperatures: 25°C (continuous line), 40°C (dashed line), and 55°C (dash-dot-dot line). The free energy profiles GI) are calculated from the statistical weights of the ensemble of microstates with a given value of θI, by using a statistical mechanical “zipper” model (details of the model and calculations are available on www.uic.edu/∼ansari/zipper_model. pdf). The discrete values of the free energies (at θI = 0, 1/6, 1/3, ½, 2/3, 5/6, and 1) are interpolated on a finer grid by using a cubic spline to get the semicontinuous profile. Diffusive dynamics on the free energy profile generated at each temperature yielded the characteristic rates for attaining equilibrium that are compared with the observed rates in Fig. 3 ac. (b) The height of the free energy barrier at 25°C is plotted versus the location of the 2AP substitution.
Figure 5
Figure 5
A schematic representation of the ensemble of microstates in the random coil, misfolded, transition “state,” and native-state conformations of the hairpin.

References

    1. Scheffler I E, Elson E L, Baldwin R L. J Mol Biol. 1968;36:291–304. - PubMed
    1. Gralla J, Crothers D M. J Mol Biol. 1973;73:497–511. - PubMed
    1. Uhlenbeck O C, Borer P N, Dengler B, Tinoco I., Jr J Mol Biol. 1973;73:483–496. - PubMed
    1. Paner T M, Amaratunga M, Doktycz M J, Benight A S. Biopolymers. 1990;29:1715–1734. - PubMed
    1. Bonnet G, Krichevsky O, Libchaber A. Proc Natl Acad Sci USA. 1998;95:8602–8606. - PMC - PubMed

Publication types

LinkOut - more resources