How alpha beta T cells deal with induced TCR alpha ablation
- PMID: 11447257
- PMCID: PMC37506
- DOI: 10.1073/pnas.141218898
How alpha beta T cells deal with induced TCR alpha ablation
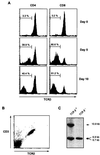
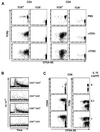
Abstract
On deletion of the gene encoding the constant region of the T cell antigen receptor (TCR)alpha chain in mature T cells by induced Cre-mediated recombination, the cells lose most of their TCR from the cell surface within 7--10 days, but minute amounts of surface-bound TCR beta chains are retained for long periods of time. In a situation in which cellular influx from the thymus is blocked, TCR-deficient naive T cells decay over time, the decay rates being faster for CD8(+) cells (t(1/2) approximately 16 days) than for CD4(+) cells (t(1/2) approximately 46 days). TCR(+) naïve cells are either maintained (CD8(+)) or decay more slowly (CD4(+); t(1/2) approximately 78 days.) Numbers of TCR-deficient memory T cells decline very slowly (CD8(+) cells; t(1/2) approximately 52 days) or not at all (CD4(+) cells), but at the population level, these cells fail to expand as their TCR(+) counterparts do. Together with earlier data on T cell maintenance in environments lacking appropriate major histocompatibility complex antigens, these data argue against the possibility that spontaneous ligand-independent signaling by the alpha beta TCR contributes significantly to T-cell homeostasis.
Figures


Similar articles
-
Impact of early expression of TCR alpha chain on thymocyte development.Eur J Immunol. 2004 Jun;34(6):1532-41. doi: 10.1002/eji.200424870. Eur J Immunol. 2004. PMID: 15162422
-
Thymus ontogeny and the development of TCR alpha beta intestinal intraepithelial lymphocytes.Cell Immunol. 1996 Jul 10;171(1):132-9. doi: 10.1006/cimm.1996.0183. Cell Immunol. 1996. PMID: 8660848
-
Retroviral-mediated expression of an MHC class I-restricted T cell receptor in the CD8 T cell compartment of bone marrow-reconstituted mice.Hum Gene Ther. 1998 Oct 10;9(15):2285-97. doi: 10.1089/hum.1998.9.15-2285. Hum Gene Ther. 1998. PMID: 9794212
-
CD4/CD8 lineage commitment in T cell receptor transgenic mice: evidence for precommitment of CD4+ CD8+ thymocytes.Semin Immunol. 1994 Aug;6(4):249-56. doi: 10.1006/smim.1994.1032. Semin Immunol. 1994. PMID: 8000034 Review.
-
CD4/CD8 lineage commitment: back to instruction?J Exp Med. 1996 Mar 1;183(3):713-5. doi: 10.1084/jem.183.3.713. J Exp Med. 1996. PMID: 8642273 Free PMC article. Review. No abstract available.
Cited by
-
Homeostatic division is not necessary for antigen-specific CD4+ memory T cell persistence.J Immunol. 2012 Oct 1;189(7):3378-85. doi: 10.4049/jimmunol.1201583. Epub 2012 Sep 5. J Immunol. 2012. PMID: 22956580 Free PMC article.
-
Self-class I MHC molecules support survival of naive CD8 T cells, but depress their functional sensitivity through regulation of CD8 expression levels.J Exp Med. 2009 Sep 28;206(10):2253-69. doi: 10.1084/jem.20082553. Epub 2009 Sep 14. J Exp Med. 2009. PMID: 19752186 Free PMC article.
-
Essential role of survivin, an inhibitor of apoptosis protein, in T cell development, maturation, and homeostasis.J Exp Med. 2004 Jan 5;199(1):69-80. doi: 10.1084/jem.20031588. Epub 2003 Dec 29. J Exp Med. 2004. PMID: 14699085 Free PMC article.
-
The Bone Marrow as Sanctuary for Plasma Cells and Memory T-Cells: Implications for Adaptive Immunity and Vaccinology.Cells. 2021 Jun 15;10(6):1508. doi: 10.3390/cells10061508. Cells. 2021. PMID: 34203839 Free PMC article. Review.
-
Requirements for the differentiation of innate T-bethigh memory-phenotype CD4+ T lymphocytes under steady state.Nat Commun. 2020 Jul 6;11(1):3366. doi: 10.1038/s41467-020-17136-1. Nat Commun. 2020. PMID: 32632165 Free PMC article.
References
-
- Lam K P, Kuhn R, Rajewsky K. Cell. 1997;90:1073–1083. - PubMed
-
- Rooke R, Waltzinger C, Benoist C, Mathis D. Immunity. 1997;7:123–134. - PubMed
-
- Takeda S, Rodewald H R, Arakawa H, Bluethmann H, Shimizu T. Immunity. 1996;5:217–228. - PubMed
-
- Witherden D, van Oers N, Waltzinger C, Weiss A, Benoist C, Mathis D. J Exp Med. 2000;191:355–364. - PubMed
Publication types
MeSH terms
Substances
LinkOut - more resources
Full Text Sources
Other Literature Sources
Molecular Biology Databases
Research Materials

