

A hebbian form of long-term potentiation dependent on mGluR1a in hippocampal inhibitory interneurons
- PMID: 11447296
- PMCID: PMC55433
- DOI: 10.1073/pnas.161493498
A hebbian form of long-term potentiation dependent on mGluR1a in hippocampal inhibitory interneurons
Abstract
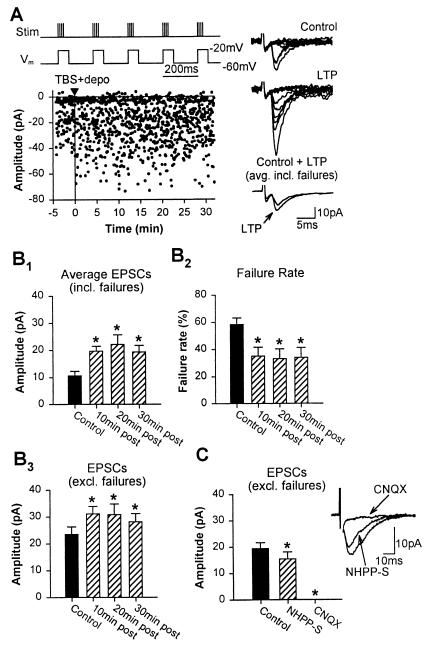
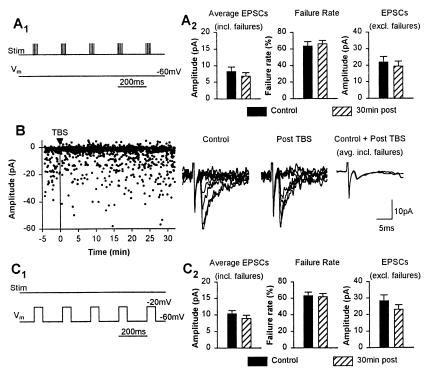
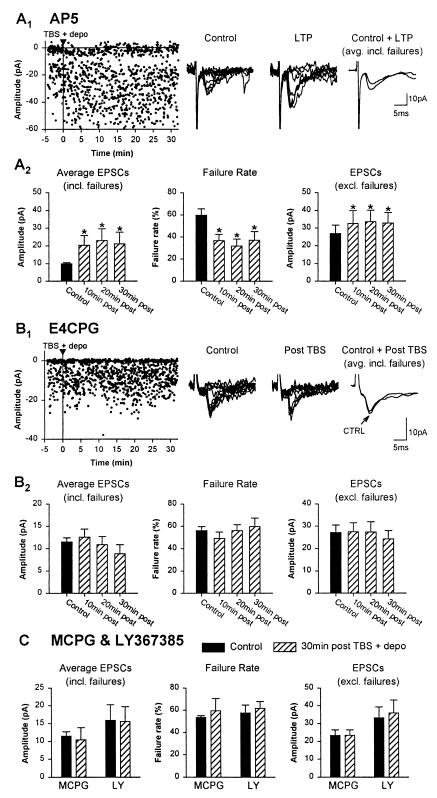
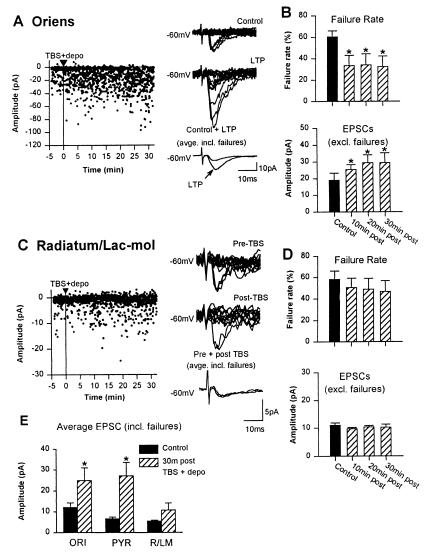
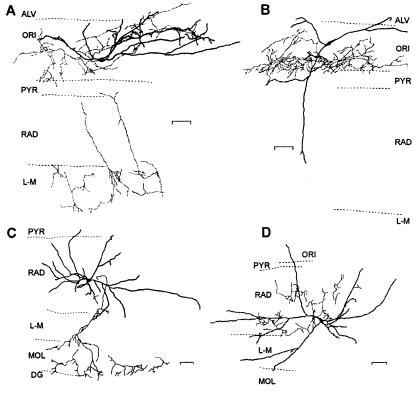
Hippocampal inhibitory interneurons play important roles in controlling the excitability and synchronization of pyramidal cells, but whether they express long-term synaptic plasticity that contributes to hippocampal network function remains uncertain. We found that pairing postsynaptic depolarization with theta-burst stimulation induced long-term potentiation (LTP) of putative single-fiber excitatory postsynaptic currents in interneurons. Either postsynaptic depolarization or theta-burst stimulation alone failed to induce LTP. LTP was expressed as a decrease in failure rates and an increase in excitatory postsynaptic current amplitude, independent of N-methyl-d-aspartate receptors, and dependent on metabotropic glutamate receptors subtype 1a. LTP was induced specifically in interneurons in stratum oriens and not in interneurons of stratum radiatum/lacunosum-moleculare. Thus, excitatory synapses onto specific subtypes of inhibitory interneurons express a new form of hebbian LTP that will contribute to hippocampal network plasticity.
Figures
Similar articles
-
GABAB receptor- and metabotropic glutamate receptor-dependent cooperative long-term potentiation of rat hippocampal GABAA synaptic transmission.J Physiol. 2003 Nov 15;553(Pt 1):155-67. doi: 10.1113/jphysiol.2003.049015. Epub 2003 Sep 8. J Physiol. 2003. PMID: 12963794 Free PMC article.
-
Subthreshold contribution of N-methyl-d-aspartate receptors to long-term potentiation induced by low-frequency pairing in rat hippocampal CA1 pyramidal cells.Neuroscience. 2004;126(1):83-94. doi: 10.1016/j.neuroscience.2004.03.034. Neuroscience. 2004. PMID: 15145075
-
Synaptic plasticity in morphologically identified CA1 stratum radiatum interneurons and giant projection cells.Hippocampus. 2000;10(6):673-83. doi: 10.1002/1098-1063(2000)10:6<673::AID-HIPO1005>3.0.CO;2-O. Hippocampus. 2000. PMID: 11153713
-
[What mechanisms underlie involvement of different NMDA receptor subunits in the induction of hippocampal long-term potentiation and long-term depression?].Zh Vyssh Nerv Deiat Im I P Pavlova. 2006 May-Jun;56(3):420-4. Zh Vyssh Nerv Deiat Im I P Pavlova. 2006. PMID: 16869279 Review. Russian.
-
Long-term synaptic plasticity in hippocampal feedback inhibitory networks.Prog Brain Res. 2008;169:241-50. doi: 10.1016/S0079-6123(07)00014-3. Prog Brain Res. 2008. PMID: 18394478 Review.
Cited by
-
Synaptic Plasticity in Cortical Inhibitory Neurons: What Mechanisms May Help to Balance Synaptic Weight Changes?Front Cell Neurosci. 2020 Sep 4;14:204. doi: 10.3389/fncel.2020.00204. eCollection 2020. Front Cell Neurosci. 2020. PMID: 33100968 Free PMC article. Review.
-
Activity-dependent compartmentalized regulation of dendritic Ca2+ signaling in hippocampal interneurons.J Neurosci. 2009 Apr 8;29(14):4658-63. doi: 10.1523/JNEUROSCI.0493-09.2009. J Neurosci. 2009. PMID: 19357290 Free PMC article.
-
Hippocampal Somatostatin Interneurons, Long-Term Synaptic Plasticity and Memory.Front Neural Circuits. 2021 Jun 2;15:687558. doi: 10.3389/fncir.2021.687558. eCollection 2021. Front Neural Circuits. 2021. PMID: 34149368 Free PMC article.
-
Plasticity in Single Axon Glutamatergic Connection to GABAergic Interneurons Regulates Complex Events in the Human Neocortex.PLoS Biol. 2016 Nov 9;14(11):e2000237. doi: 10.1371/journal.pbio.2000237. eCollection 2016 Nov. PLoS Biol. 2016. PMID: 27828957 Free PMC article.
-
Cell type-specific long-term plasticity at glutamatergic synapses onto hippocampal interneurons expressing either parvalbumin or CB1 cannabinoid receptor.J Neurosci. 2010 Jan 27;30(4):1337-47. doi: 10.1523/JNEUROSCI.3481-09.2010. J Neurosci. 2010. PMID: 20107060 Free PMC article.
References
-
- Bliss T V P, Collingridge G L. Nature (London) 1993;361:31–39. - PubMed
-
- Malenka R, Nicoll R. Science. 1999;285:1870–1874. - PubMed
-
- Bashir Z I, Bortolotto Z A, Davies C H, Berretta N, Irving A J, Seal A J, Henley J M, Jane D E, Watkins J C, Collingridge G L. Nature (London) 1993;363:347–350. - PubMed
-
- Cavus I, Teyler T J. J Neurophysiol. 1996;76:3038–3047. - PubMed
-
- Grover L M, Yan C. J Neurophysiol. 1999;82:2956–2969. - PubMed
Publication types
MeSH terms
Substances
LinkOut - more resources
Full Text Sources
