. 2001 Jul 9;154(1):33-48.
doi: 10.1083/jcb.200011069.

Large-scale chromatin decondensation and recondensation regulated by transcription from a natural promoter

Affiliations

Large-scale chromatin decondensation and recondensation regulated by transcription from a natural promoter

W G Müller et al. J Cell Biol. .

Abstract

We have examined the relationship between transcription and chromatin structure using a tandem array of the mouse mammary tumor virus (MMTV) promoter driving a ras reporter. The array was visualized as a distinctive fluorescent structure in live cells stably transformed with a green fluorescent protein (GFP)-tagged glucocorticoid receptor (GR), which localizes to the repeated MMTV elements after steroid hormone treatment. Also found at the array by immunofluorescence were two different steroid receptor coactivators (SRC1 and CBP) with acetyltransferase activity, a chromatin remodeler (BRG1), and two transcription factors (NFI and AP-2). Within 3 h after hormone addition, arrays visualized by GFP-GR or DNA fluorescent in situ hybridization (FISH) decondensed to varying degrees, in the most pronounced cases from a approximately 0.5-microm spot to form a fiber 1-10 microm long. Arrays later recondensed by 3-8 h of hormone treatment. The degree of decondensation was proportional to the amount of transcript produced by the array as detected by RNA FISH. Decondensation was blocked by two different drugs that inhibit polymerase II, 5,6-dichloro-1-beta-D-ribofuranosylbenzimidazole (DRB) and alpha-amanitin. These observations demonstrate a role for polymerase in producing and maintaining decondensed chromatin. They also support fiber-packing models of higher order structure and suggest that transcription from a natural promoter may occur at much higher DNA-packing densities than reported previously.


Figures

Figure 1.
Figure 1.
Every 3617 cell contains at least one MMTV array, and these arrays are visible by GFP-GR in a subset of cells. (a) A low magnification projection image constructed from 16 confocal sections, .28 μm apart, showing 3617 cells that were removed from tetracycline for 16 h and then treated with 100 nM dexamethasone for 1.5 h. Note that the GFP-GR is concentrated in the nucleus of each cell. At least two cells exhibit moderately large MMTV arrays, indicated by the white circles (see McNally et al. [2000] and Figs. 2 and 7 here for a demonstration that these bright structures correspond to the MMTV array). Other nuclei do not reveal obvious array structures, although several exhibit bright structures near nucleoli that may correspond to arrays but cannot be scored definitively at this low magnification. (b) Control DNA FISH with a probe specific for the MMTV array on mouse C127 cells, the grandparent of 3617 that lacks the MMTV array. No DNA FISH signal is detected. Contrast has been amplified in this panel to permit visualization of background staining in the nucleus. (c) DNA FISH with a probe specific for the MMTV array on 3617 cells. Each nucleus shows a distinct FISH signal, indicating that every cell contains at least one copy of the MMTV array. (Sometimes nuclei are observed with two such signals; data not shown.) Bar, 10 μm.
Figure 2.
Figure 2.
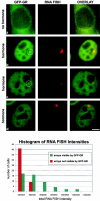
After hormone, most MMTV arrays produce some transcript, but transcript levels are lowest in cells lacking a visible GFP-GR array. (a) In the absence of hormone, GFP-GR is found in the cytoplasm, and no ras or BPV transcript is detected in the nuclei. (b) Upon addition of hormone, the GFP-GR translocates into the nucleus within 10 min and GFP-GR array structures become visible in many cells. These GFP-GR arrays consistently colocalize with the ras-BPV RNA FISH signal. (c) In some cells, the RNA FISH signal can be used to identify a putative array structure that with GFP-GR alone would be difficult to identify. (d) Although 90% of cells exhibit an RNA FISH signal, in some cells the corresponding GFP-GR array structure is not visible. A histogram plot (bottom) shows that cells without a visible GFP-GR array (red bars) exhibit the lowest levels of transcript compared with cells with a visible GFP-GR array (green bars). 50 cells from each category were analyzed by measuring the total RNA FISH intensity for each cell. Cells were treated with 100 nM dexamethasone for 3 h in b–d and for 1 h in e. Bar, 5 μm.
Figure 3.
Figure 3.
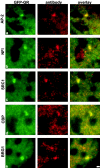
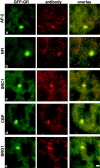
Various cofactors known from biochemical studies to associate with the MMTV template are found in the vicinity of the MMTV array. Cells were treated with 100 nM dexamethasone for 25 min then fixed in paraformaldehyde. Red fluorescent secondary antibodies were used to permit comparison with the green GFP-GR array. Considerable overlap with the GFP-GR array was seen for the transcription factor AP-2 (a), another transcription factor, NFI (b), the coactivator SRC1 (c), another coactivator CBP (d), and a remodeler, BRG1 (e). Bar, 1 μm.
Figure 4.
Figure 4.
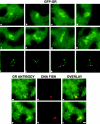
GFP-GR arrays exhibit a variety of structures that correspond to the underlying DNA structure of the array. Cells were treated with 100 nM dexamethasone for 2 h and then fixed for examination by fluorescence microscopy. Smaller arrays tend to exhibit a more uniform fluorescence distribution (a–c), whereas larger arrays show a more complex fluorescent pattern that can often be described as beaded (d–h). The beaded structure is connected by thinner and dimmer strands as revealed in three-dimensional deconvolved images. A projection of such an image is shown in panel i, with a series of optical sections at progressive depths shown in panel j–l, with arrows indicating the region in focus. The connecting strands can be followed around the array structure except for the position marked with the arrow in panel l. The larger gap near the top of the structure probably reflects the start and end points of the array as judged by a stereo view (not shown). GFP-GR structures correspond to the underlying DNA structure of the array as demonstrated by combined GR antibody (m and p) and DNA FISH (n and q), which show overlap for condensed (o) and decondensed arrays (r). Bar, 1 μm.
Figure 5.
Figure 5.
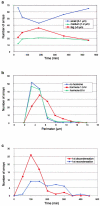
Arrays increase in size after hormone treatment and then later decrease. (a) Array size by GFP-GR versus time after hormone. Changes in array size were detected by GFP-GR as a function of time. Cells were treated with 100 nM dexamethasone at time 0 and then fixed in paraformaldehyde at the time points shown. At each time point, 100 cells containing arrays were randomly selected and then the arrays were classified into one of three size ranges. (b) Changes in array size detected by DNA FISH before hormone and 1.5 or 8 h after hormone. For each treatment, 100 cells were randomly selected and then the perimeter of the array in each cell was measured. Note that by 8 h after hormone treatment, arrays have recondensed to the prehormone state. (c) Times of array decondensation and recondensation by live cell analysis. Histogram plot showing times at which arrays showed the first significant signs of either decondensation or condensation. These data were obtained from 128 time-lapse movies of individual cells. On average, decondensation occurred before condensation. Of 22 movies that were long enough to capture both decondensation and condensation, 21 showed a single decondensation followed by a single recondensation (see text).
Figure 6.
Figure 6.
Time lapse sequences of arrays. Sequences show either no significant change in length (a; ∼33% of movies), moderate length changes (b; ∼26% of movies), or dramatic length changes (c; ∼40% of movies). Time in minutes after addition of 100 nM dexamethasone is shown in the bottom right corner of each image. Bar, 1 μm.
Figure 7.
Figure 7.
The amount of transcript produced by the array is correlated with array size. Specimens prepared as in the legend to Fig. 2. Shown in the top row (a–f) are GFP-GR arrays from different cells fixed at 3 h of 100 nM dexamethasone. The corresponding RNA FISH signals are shown in the middle row and the overlay images in the bottom row. Note that progressive increase in array size (a–f) is accompanied by progressive increase in the RNA FISH signal. This correlation is confirmed by quantitative analysis of 113 cells as shown in the plot at the bottom of the figure. Each point in the plot represents an array, like those in panels a–f, whose total RNA FISH intensity has been measured and plotted as a function of the measured perimeter of the array. Bar, 1 μm.
Figure 8.
Figure 8.
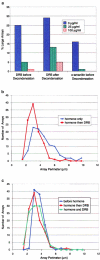
Transcription is required for decondensation. (a) Shown are the percentage of large arrays (>3 μm in length) observed at different DRB concentrations after two different treatment regimens. The data labeled “DRB before Decondensation” come from cells treated simultaneously with 100 nM dexamethasone and different concentrations of DRB. After 2 h, the number of large decondensed arrays was counted. Note that large decondensed arrays decreased significantly in the DRB-treated cells. The cells labeled “DRB after Decondensation” were first treated with 100 nM dexamethasone for 1.5 h to allow arrays to decondense. Then DRB was added at the concentrations indicated, and after a 30–min incubation the percentage of large arrays was determined. Note the significant closing of arrays after the short DRB treatment. Similar results were obtained with α-amanitin. To permit α-amanitin entry, cells were pretreated for 2 h with the drug at the concentrations indicated, and then 100 nM dexamethasone was added for 1.5 h and the number of large arrays was counted. (b) Distribution of array sizes before and after DRB. The effects of DRB on recondensation were not specific to large arrays. Array perimeters were measured from 100 randomly selected cells, each treated with 100 nM hormone for 2 h and then fixed in paraformaldehyde. This distribution was compared with perimeters from cells treated identically except for the addition of 100 μg/ml DRB in the last half hour before fixation. The perimeter distribution after DRB (red, ▪) is shifted to smaller sizes. (c) Comparison of array sizes after DRB to before hormone. A comparable shift in the perimeter distribution occurs when DRB is added with hormone (green curve, ▴). Whether DRB is added with or 1.5 h after hormone, the perimeter distribution (assayed by GFP-GR) resembles that before hormone was added (blue curve, ♦; assayed by DNA FISH). This demonstrates that DRB treatment induces condensation to the prehormone state.
Figure 9.
Figure 9.
After 100 μg/ml DRB treatment, factors are still at the array. Transcription factors AP-2 (a) or NFI (b); coactivators SRC1 (c) or CBP (d); or the remodeler BRG1 (e) are shown. Cells were treated with DRB and 100 nM dexamethasone for either 1 (b and e) or 2 h (a, c, and d) and then fixed and stained for immunofluorescence. Bar, 1 μm.

Similar articles

Cited by

References

    1. Andersson, K., R. Mahr, B. Bjorkroth, and B. Daneholt. 1982. Rapid reformation of the thick chromosome fiber upon completion of RNA synthesis at the Balbiani ring genes in Chironomus tentans. Chromosoma. 87:33–48. - PubMed
    1. Andersson, K., B. Bjorkroth, and B. Daneholt. 1984. Packing of a specific gene into higher order structures following repression of RNA synthesis. J. Cell Biol. 98:1296–1303. - PMC - PubMed
    1. Archer, T.K., P. Lefebvre, R.G. Wolford, and G.L. Hager. 1992. Transcription factor loading on the MMTV promoter: a bimodal mechanism for promoter activation. Science. 255:1573–1576. - PubMed
    1. Archer T.K., H.L. Lee, M.G. Cordingley, J.S. Mymryk, G. Fragoso, D.S. Berard, and G.L. Hager. 1994. Differential steroid hormone induction of transcription from the mouse mammary tumor virus promoter. Mol. Endocrinol. 8:568–576. - PubMed
    1. Ashburner, M. 1990. Puffs, genes, and hormones revisited. Cell. 61:1–3. - PubMed

Publication types

MeSH terms

Substances