. 2001 Jul 9;154(1):71-84.
doi: 10.1083/jcb.200101089.

Nuclear pore complexes form immobile networks and have a very low turnover in live mammalian cells

Affiliations

Nuclear pore complexes form immobile networks and have a very low turnover in live mammalian cells

N Daigle et al. J Cell Biol. .

Abstract

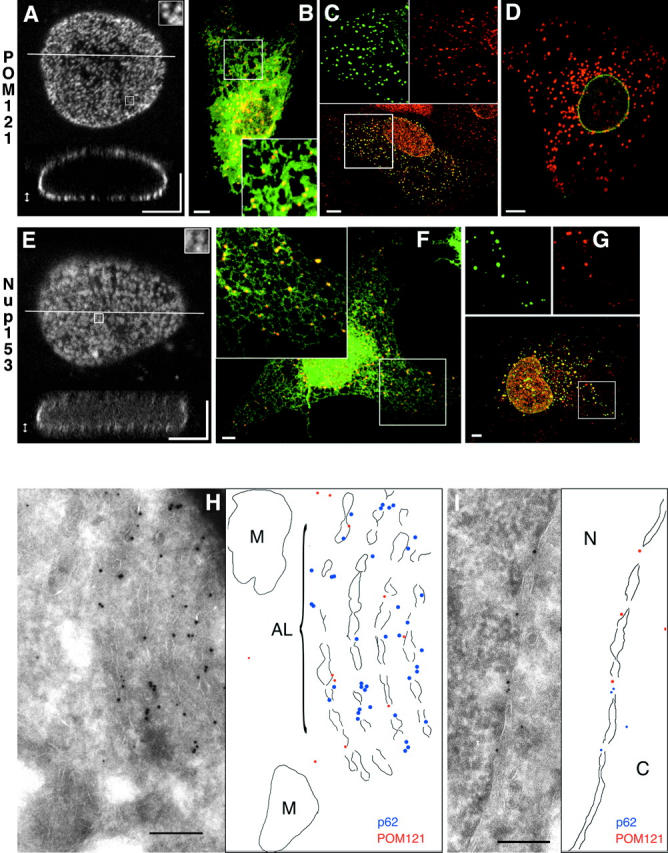
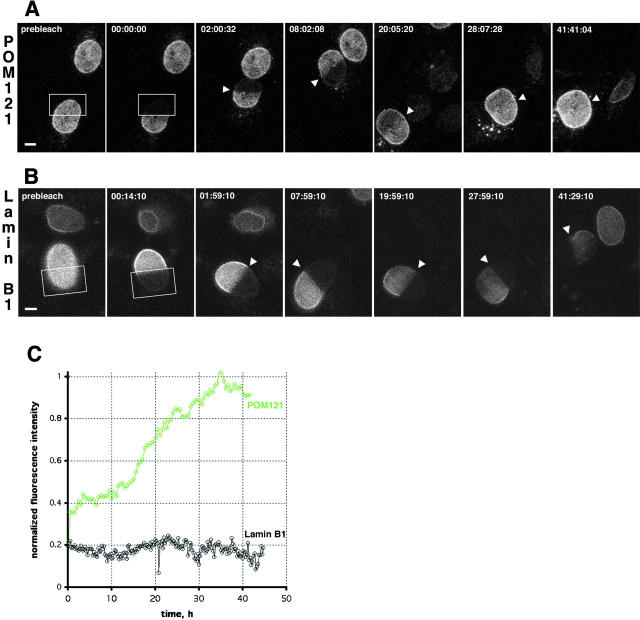
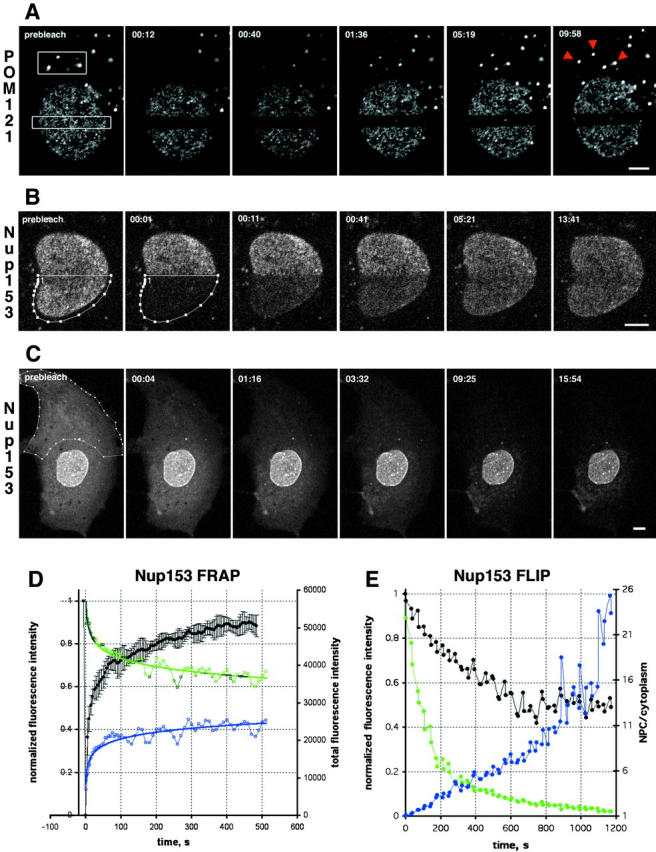
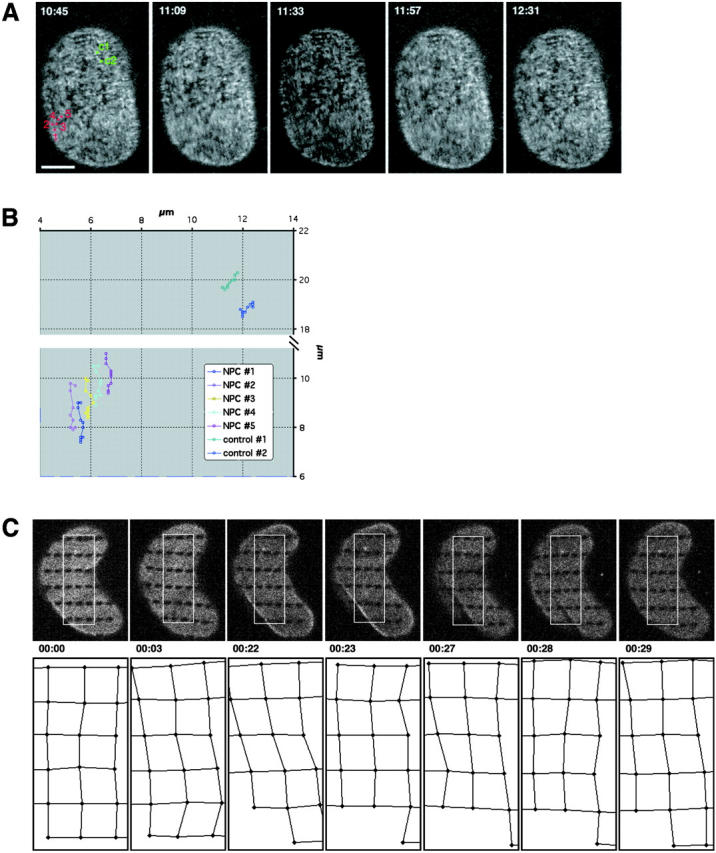
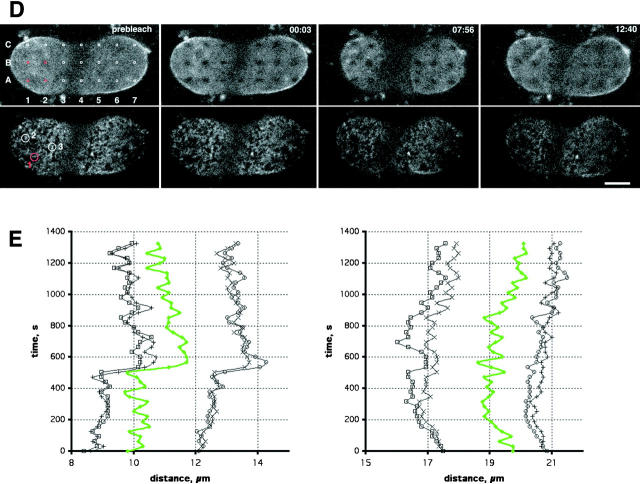
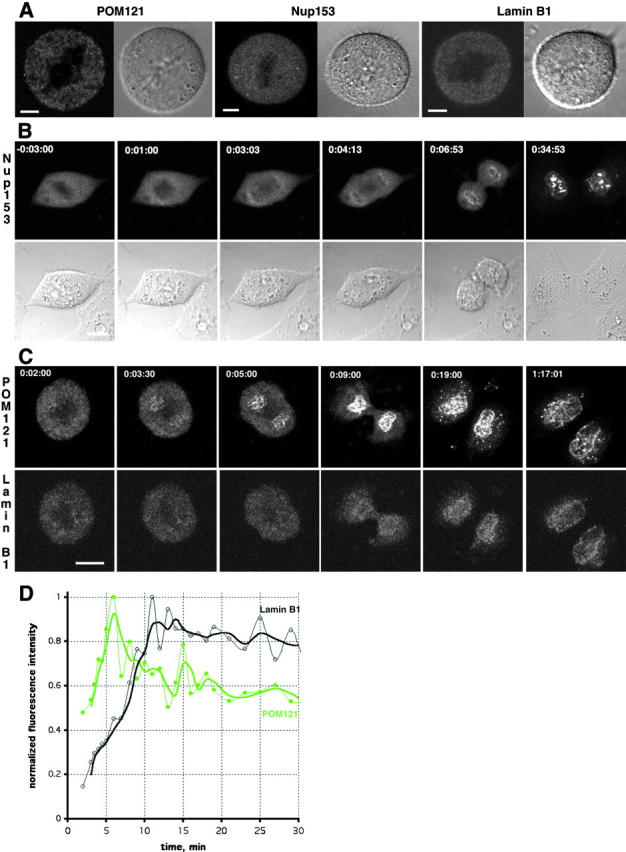
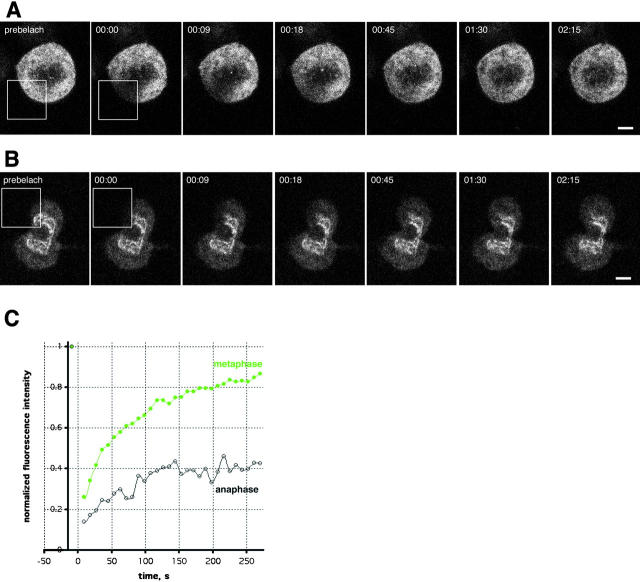
The nuclear pore complex (NPC) and its relationship to the nuclear envelope (NE) was characterized in living cells using POM121-green fluorescent protein (GFP) and GFP-Nup153, and GFP-lamin B1. No independent movement of single pore complexes was found within the plane of the NE in interphase. Only large arrays of NPCs moved slowly and synchronously during global changes in nuclear shape, strongly suggesting mechanical connections which form an NPC network. The nuclear lamina exhibited identical movements. NPC turnover measured by fluorescence recovery after photobleaching of POM121 was less than once per cell cycle. Nup153 association with NPCs was dynamic and turnover of this nucleoporin was three orders of magnitude faster. Overexpression of both nucleoporins induced the formation of annulate lamellae (AL) in the endoplasmic reticulum (ER). Turnover of AL pore complexes was much higher than in the NE (once every 2.5 min). During mitosis, POM121 and Nup153 were completely dispersed and mobile in the ER (POM121) or cytosol (Nup153) in metaphase, and rapidly redistributed to an immobilized pool around chromatin in late anaphase. Assembly and immobilization of both nucleoporins occurred before detectable recruitment of lamin B1, which is thus unlikely to mediate initiation of NPC assembly at the end of mitosis.


Figures

Figure 1.
Figure 1.
POM121-GFP and GFP-Nup153 label single NPCs and induce AL in live cells. (A–G) Images are confocal z-stacks (A and E) or single sections (B–D, F, and G). (A) Three-dimensional reconstruction of a live NRK cell nucleus expressing POM121-EGFP3. Top, maximum intensity projected of optical sections of the lower nuclear surface (double-pointed arrow). Inset enlarges 1 μm2 to show labeling of single NPCs. Bottom, xz slice at the line indicated in the top panel. (B) Live PtK2 cell coexpressing POM121-YFP3 (red) and SRβ-ECFP (green). AL labeled by POM121 are in direct contact to or colocalize with ER tubules and sheets as marked by SRβ. (C) HeLa cell expressing POM121-EGFP3 (green), fixed and stained for the endogenous nucleoporin p62 (red). Since the p62 antibody did not cross-react in PtK2 cells, HeLa cells were used for this experiment. AL containing POM121 colocalize with p62 antibodies (yellow in the merged lower panel, compare patterns in the split inset images). (D) Live PtK2 cell coexpressing ECFP–lamin B1 (green) and POM121-YFP3 (red). AL labeled by POM121 do not contain lamin B1. (E) Three-dimensional reconstruction of a live NRK cell nucleus expressing EGFP3-Nup153. Projections as in A. (F) Live COS7 cell coexpressing EGFP3-Nup153 (red) and SRβ-ECFP (green). COS7 cells were used for better ER morphology than NRK cells (compare with B). Yellow shows colocalization of AL with ER tubules. (G) COS7 cell expressing EGFP3-Nup153 (red) fixed and stained for the en- dogenous nucleoporin POM121 (red). AL containing Nup153 also label with anti-POM121 antibodies (yellow in the merged lower panel, compare patterns in the split inset images). Some POM121-positive structures do not contain Nup153. (H and I) Cryoimmuno double labeling electron micrographs from HeLa cells expressing POM121-EGFP3. Membrane boundaries are outlined next to the micrographs. Labeled are rat POM121 (10-nm gold) and human p62 (5-nm gold). POM121 and p62 colocalize on fenestrated membrane stacks (AL) in H and nuclear pores in I. M, mitochondria; N, nucleus; C, cytoplasm. Bars: (A–G) 5 μm; (H and I) 200 nm.
Figure 2.
Figure 2.
Turnover of NPCs and the lamina measured by FRAP. (A) FRAP of NRKPOM121-YFP3 cells. The boxed area was photobleached to background levels. Recovery was monitored immediately after the bleach and every 30 min by taking a stack of five confocal images after autofocussing. Representative maximum intensity projections are shown. Arrowheads mark the boundary between bleached and nonbleached regions. Time, hh:mm:ss. See Video 1 for the entire sequence. (B) FRAP experiment similar to A of NRK cells transiently expressing EGFP–lamin B1. Single confocal sections 0.5 μm above the coverslip surface were acquired every 15 min after autofocussing. Times, scale, and arrowheads as in A. See Video 2 for the entire sequence. (C) Plot shows fluorescence recovery of POM121 (green) and lamin B1 (black) in the bleached regions. Bleached and nonbleached half of the nuclei were tracked manually to measure mean intensities. Values were background subtracted and then normalized to total loss of fluorescence. Bars, 5 μm. Online supplemental material (Videos 1 and 2) is available at http://www.jcb.org/cgi/content/full/200101089/DC1.
Figure 3.
Figure 3.
Turnover of nucleoporins within NPCs and ALPCs measured by FRAP. (A) FRAP of NRK cells expressing POM121-EGFP3 transiently. Boxed regions were photobleached and fluorescence recovery of ALPCs and NPCs was followed immediately after the bleach and then every 28 s in confocal sections. Arrowheads indicate the bleached AL. Note difference in recovery of AL and NPCs. Time, mm:ss. For quantitation see online supplemental Fig. S1 A. (B) FRAP of NRK cells expressing EGFP2-Nup153 transiently. Recovery was monitored immediately after the bleach and then every 5 s. Time and scale as in A. (C) FLIP of PtK2 cells expressing EGFP2-Nup153 transiently. Outlined region was photobleached repetitively 30 times every 30 s. Before and after each bleach the depletion of fluorescence was monitored in a confocal section. Time and scale as in A. (D) Plots of recovery in the bleached half and equilibration between bleached and nonbleached half of a Nup153 FRAP similar to B. Average mean intensities of the bleached region (black, left Y-axis) and standard deviation (n = 4). Data was normalized for total loss of fluorescence. Change of total fluorescence from the nonbleached (green) and bleached half (blue, both right Y-axis) measured for the experiment shown in B. (E) Plots of EGFP2-Nup153 depletion from the nucleus and cytoplasm for the FLIP in C. Average nuclear (black), cytoplasmic (green, both left Y-axis), and ratio of NPC/cytoplasmic fluorescence (blue, right Y-axis) is shown. Data was normalized to total loss of fluorescence. Note that nuclear fluorescence remains constant after initial loss of overlapping cytoplasmic signal, whereas cytoplasmic fluorescence is reduced to background levels. Bars, 5 μm. Online supplemental material (Fig. S1) is available at http://www.jcb.org/cgi/content/full/200101089/DC1.
Figure 4.
Figure 4.
Tracking of NPC and lamina movement in interphase. (A) Time-lapse of a NRK cell expressing POM121-EGFP3 transiently. The lower nuclear surface was followed in a single confocal section every 2 s for a total of 30 min on a real-time confocal microscope. Sequence was averaged with a running window of five frames. Representative frames show numbered NPCs in a time window of ∼2 min used for tracking in B. Time, mm:ss. NPC movement is difficult to appreciate in still images; see Video 3 for the complete sequence. (B) Tracking of NPC movement. NPCs labeled #1–5 in A in a region of local NE movement are tracked together with two NPCs labeled C1 and C2 in A, which reside in an area of little movement and serve to illustrate global nuclear drift. Note the parallel and synchronous tracks of the NPCs. (C) Pattern FRAP of an NRK cell nucleus transiently expressing EGFP–Lamin B1. 33 1 × 0.5-μm regions were photobleached in the lower nuclear surface. Movement of landmarks was followed in single confocal sections every minute for 30 min (top row). Marks in the boxed area were used to track elastic deformations of the lamin lattice. Global cellular movement was corrected with two reference points. Relative position changes are shown in the bottom row as a network connecting the center of the bleach marks. Time, h:mm:ss; horizontal box length, 6 μm. (D) Pattern FRAP of a NRK nucleus transiently coexpressing POM121-YFP3 and ECFP–lamin B1. The outlined 21 0.9 × 0.6-μm regions were photobleached selectively in the lamina using a 413-nm Kr laser line. Movement of the lamina landmarks and the unbleached NPCs was then followed in single double-labeled confocal sections every 31 s for 30 min. Representative frames show distortion of nuclear shape by cell migration (note lamina folding at 07:56 and 12:40). Marks and NPCs used for tracking in E are red. Time, mm:ss. See Video 4 to better appreciate lamina elasticity. (E) Tracking of NPCs and lamina bleachmarks. Exemplary time-space tracks are shown for NPC #1 (green) and lamin grid marks A1–B2 (black) over 22 min in x, t and y, t plots. Global nuclear drift was normalized using to B5 and B7 marks. Note correlation between the x and y lamina and NPC movement. NPCs #2 and 3 and the surrounding marks behaved identically (not shown). Bars, 5 μm. Online supplemental material (Videos 3 and 4) is available at http://www.jcb.org/cgi/content/full/200101089/DC1.
Figure 4.
Figure 4.
Tracking of NPC and lamina movement in interphase. (A) Time-lapse of a NRK cell expressing POM121-EGFP3 transiently. The lower nuclear surface was followed in a single confocal section every 2 s for a total of 30 min on a real-time confocal microscope. Sequence was averaged with a running window of five frames. Representative frames show numbered NPCs in a time window of ∼2 min used for tracking in B. Time, mm:ss. NPC movement is difficult to appreciate in still images; see Video 3 for the complete sequence. (B) Tracking of NPC movement. NPCs labeled #1–5 in A in a region of local NE movement are tracked together with two NPCs labeled C1 and C2 in A, which reside in an area of little movement and serve to illustrate global nuclear drift. Note the parallel and synchronous tracks of the NPCs. (C) Pattern FRAP of an NRK cell nucleus transiently expressing EGFP–Lamin B1. 33 1 × 0.5-μm regions were photobleached in the lower nuclear surface. Movement of landmarks was followed in single confocal sections every minute for 30 min (top row). Marks in the boxed area were used to track elastic deformations of the lamin lattice. Global cellular movement was corrected with two reference points. Relative position changes are shown in the bottom row as a network connecting the center of the bleach marks. Time, h:mm:ss; horizontal box length, 6 μm. (D) Pattern FRAP of a NRK nucleus transiently coexpressing POM121-YFP3 and ECFP–lamin B1. The outlined 21 0.9 × 0.6-μm regions were photobleached selectively in the lamina using a 413-nm Kr laser line. Movement of the lamina landmarks and the unbleached NPCs was then followed in single double-labeled confocal sections every 31 s for 30 min. Representative frames show distortion of nuclear shape by cell migration (note lamina folding at 07:56 and 12:40). Marks and NPCs used for tracking in E are red. Time, mm:ss. See Video 4 to better appreciate lamina elasticity. (E) Tracking of NPCs and lamina bleachmarks. Exemplary time-space tracks are shown for NPC #1 (green) and lamin grid marks A1–B2 (black) over 22 min in x, t and y, t plots. Global nuclear drift was normalized using to B5 and B7 marks. Note correlation between the x and y lamina and NPC movement. NPCs #2 and 3 and the surrounding marks behaved identically (not shown). Bars, 5 μm. Online supplemental material (Videos 3 and 4) is available at http://www.jcb.org/cgi/content/full/200101089/DC1.
Figure 5.
Figure 5.
Recruitment of nucleoporins and lamin B1 during nuclear assembly. (A) In vivo localization of transiently expressed POM121-YFP3, EGFP3-Nup153, and ECFP–lamin B1 in metaphase NRK cells. Shown are confocal sections and DIC images centered on the metaphase plate. Note reticular pattern for POM121 and diffuse distribution of Nup153 and lamin B1. (B) 4-D sequence (10 slices every 2.5 μm acquired every 10–60 s depending on the dynamics of the cell cycle stage) of an NRK cell transiently expressing EGFP2-Nup153. Transparent projection of the four slices containing chromosomes (top) and DIC images highlighting the position of the chromosomes (bottom) are shown. Recruitment of Nup153 on the surface of chromosomes starts at ∼4 min after metaphase to anaphase transition. Time, h:mm:ss normalized to meta/anaphase transition equals 0. (C) 4-D double label sequence (six slices every 3 μm acquired every 30–120 s depending on the dynamics of the cell cycle stage) of an NRK cell transiently coexpressing POM121-YFP3 (top) and ECFP–lamin B1 (bottom). Shown are maximum intensity projections of the z-slices containing chromosomes. POM121 recruitment starts ∼3.5 min after meta/anaphase transition, whereas lamin B1 is only seen at 9 min (see D). Time, h:mm:ss normalized to meta/anaphase transition equals 0. (D) Plot of mean fluorescence intensity of the reforming NE for POM121 (green) and lamin B1 (black) shown in B. Before visible accumulation of lamin, nuclear rim areas were identified by POM121 localization. Data was background subtracted and normalized for bleaching during the time series. Lines are moving averages of two frames. Note the delay of ∼5 min between peak concentration/area for POM121 versus lamin B1. Bars: (A) 5 μm; (B and C) 10 μm. Online supplemental material (Fig. S2) is available at http://www.jcb.org/cgi/content/full/200101089/DC1.
Figure 6.
Figure 6.
POM121 is immobilized during nuclear assembly in anaphase. FRAP of a NRK cell transiently expressing POM121-EGFP3. (A) Boxed area was photobleached to background levels in metaphase. Recovery was monitored every 9 s in a single image acquired with open pinhole. Note rapid recovery of fluorescence into the ER as the cell reaches metaphase/anaphase transition (02:15). (B) FRAP of the same cell as in A ∼6 min after anaphase onset. Note the absence of complete recovery during the transition to telophase. Times, hh:mm:ss. (C) Plot of recovery in the bleached areas shown in A and B for metaphase (green)and anaphase (black). Data was normalized to total loss of fluorescence, time 0 corresponds to the midpoint of the bleach. Note the difference in IFs 4 min after the bleach. Bars, 5 μm.

Comment in

References

    1. Akey, C.W. 1989. Interactions and structure of the nuclear pore complex revealed by cryo-electron microscopy. J. Cell Biol. 109:955–970. - PMC - PubMed
    1. Allen, T.D., J.M. Cronshaw, S. Bagley, E. Kiseleva, and M.W. Goldberg. 2000. The nuclear pore complex: mediator of translocation between nucleus and cytoplasm. J. Cell Sci. 113:1651–1659. - PubMed
    1. Bastos, R., A. Lin, M. Enarson, and B. Burke. 1996. Targeting and function in mRNA export of nuclear pore complex protein Nup153. J. Cell Biol. 134:1141–1156. - PMC - PubMed
    1. Belgareh, N., and V. Doye. 1997. Dynamics of nuclear pore distribution in nucleoporin mutant yeast cells. J. Cell Biol. 136:747–759. - PMC - PubMed
    1. Belgareh, N., and V. Doye. 1999. Yeast and vertebrate nuclear pore complexes: evolutionary conserved, yet divergent macromolecular assemblies. Protoplasma. 209:133–143.

Publication types

MeSH terms