Comparative Study
. 2001 Jul;13(7):1499-510.
doi: 10.1105/tpc.010011.

Growth stage-based phenotypic analysis of Arabidopsis: a model for high throughput functional genomics in plants

Affiliations
Comparative Study

Growth stage-based phenotypic analysis of Arabidopsis: a model for high throughput functional genomics in plants

D C Boyes et al. Plant Cell. 2001 Jul.

Abstract

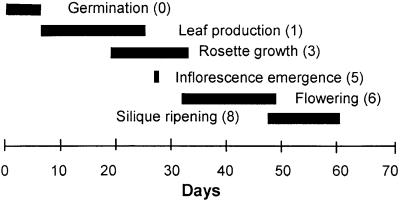
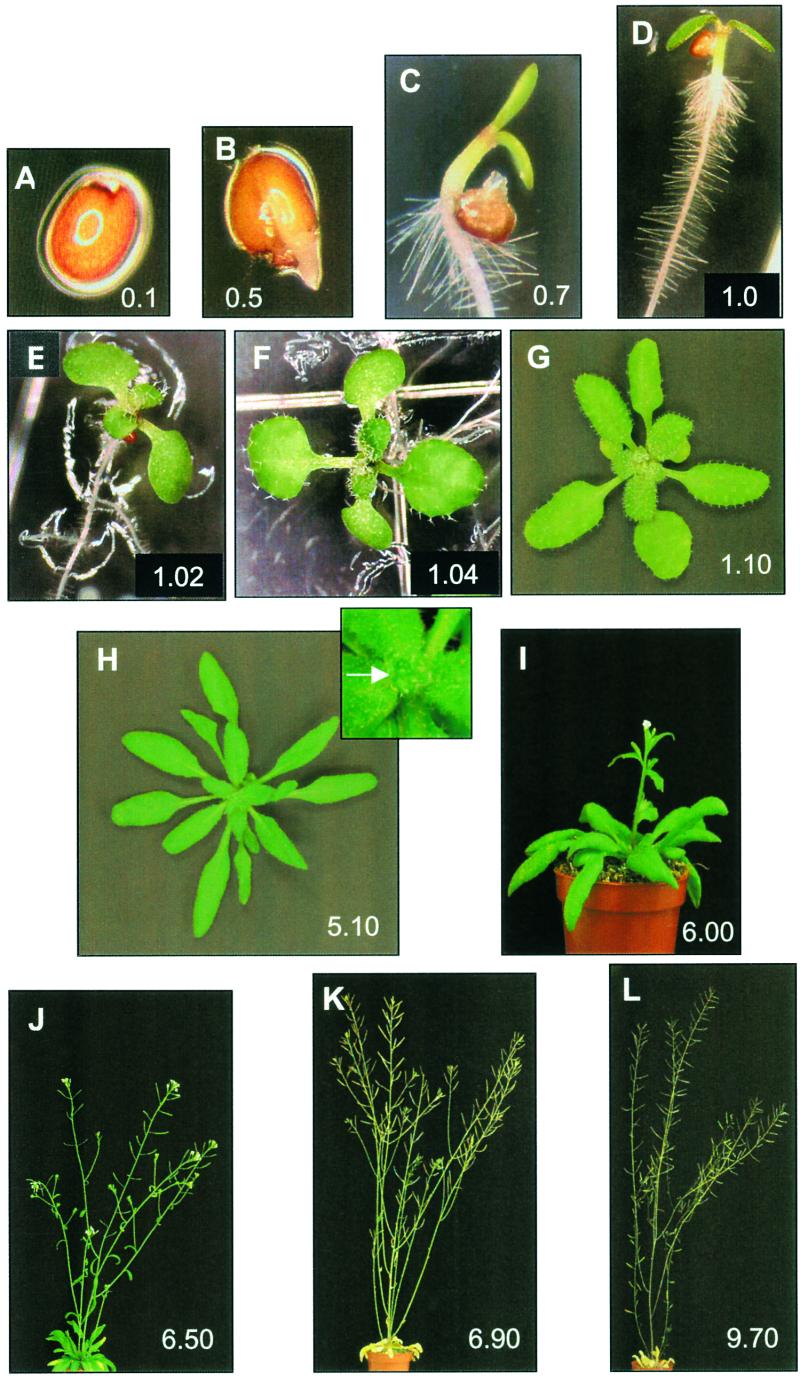
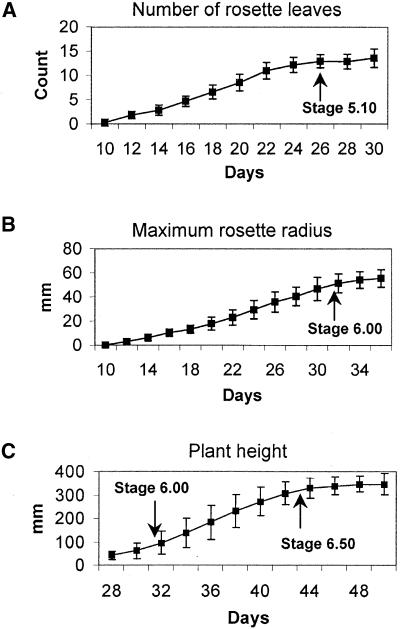
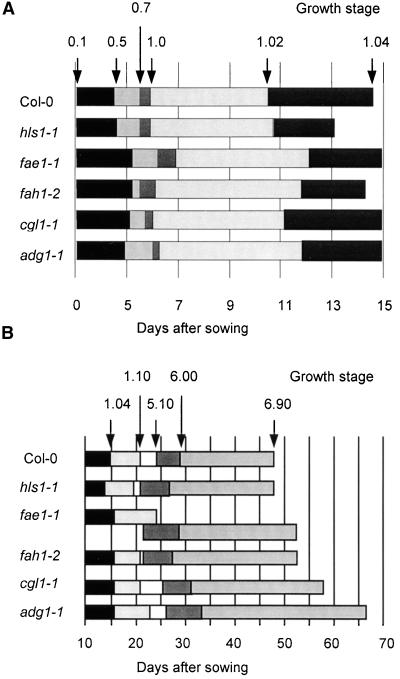
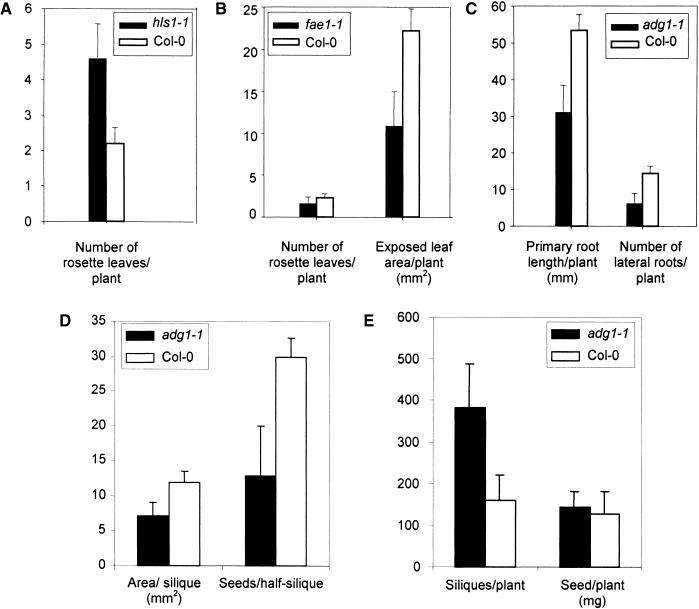
With the completion of the Arabidopsis genome sequencing project, the next major challenge is the large-scale determination of gene function. As a model organism for agricultural biotechnology, Arabidopsis presents the opportunity to provide key insights into the way that gene function can affect commercial crop production. In an attempt to aid in the rapid discovery of gene function, we have established a high throughput phenotypic analysis process based on a series of defined growth stages that serve both as developmental landmarks and as triggers for the collection of morphological data. The data collection process has been divided into two complementary platforms to ensure the capture of detailed data describing Arabidopsis growth and development over the entire life of the plant. The first platform characterizes early seedling growth on vertical plates for a period of 2 weeks. The second platform consists of an extensive set of measurements from plants grown on soil for a period of approximately 2 months. When combined with parallel processes for metabolic and gene expression profiling, these platforms constitute a core technology in the high throughput determination of gene function. We present here analyses of the development of wild-type Columbia (Col-0) plants and selected mutants to illustrate a framework methodology that can be used to identify and interpret phenotypic differences in plants resulting from genetic variation and/or environmental stress.


Figures

Figure 1.
Figure 1.
Scheme of the Chronological Progression of Principal Growth Stages in Arabidopsis. Horizontal bars indicate the period during wild-type Col-0 plant development when the indicated trait can be used in growth stage determination. Numbers in parentheses correspond to principal growth stages listed in Table 1.
Figure 2.
Figure 2.
Arabidopsis Growth Stages. (A) Stage 0.1, imbibition. (B) Stage 0.5, radicle emergence. (C) Stage 0.7, hypocotyl and cotyledons emerged from seed coat. (D) Stage 1.0, cotyledons opened fully. (E) Stage 1.02, two rosette leaves >1 mm in length. (F) Stage 1.04, four rosette leaves >1 mm in length. (G) Stage 1.10, ten rosette leaves >1 mm in length. (H) Stage 5.10, first flower buds visible (indicated by arrow in inset). (I) Stage 6.00, first flower open. (J) Stage 6.50, midflowering. (K) Stage 6.90, flowering complete. (L) Stage 9.70, senescent and ready for seed harvest. (A) to (F) were determined in the early analysis platform. (G) to (L) were determined in the soil-based platform.
Figure 3.
Figure 3.
Representative Data from Wild-Type Col-0 Plants. (A) Number of rosette leaves >1 mm in length produced over time. (B) Maximum rosette radius (i.e., length of the longest rosette leaf) over time. (C) Plant height over time. Arrows indicate the time at which growth stages 5.10, 6.00, and 6.50 occur. Data are given as averages ±sd for >300 individual plants. Days are given relative to date of sowing, including a 3-day stratification at 4°C to synchronize seed germination.
Figure 4.
Figure 4.
Growth Stage Progression for Wild-Type (Col-0) and Five Mutant Lines. (A) Progression as determined in the plate-based early analysis platform. (B) Progression as determined in the soil-based analysis platform. Arrows define the time (days after sowing) at which Col-0 plants reached the growth stages indicated. Boxes represent the time elapsed between the occurrence of successive growth stages. Junctions between boxes of different shading indicate the occurrence of a growth stage. In (B), overlapping boxes for fae1-1 indicate that growth stage 5.10 was reached before stage 1.10. Days are given relative to date of sowing, including a 3-day stratificaton at 4°C to synchronize seed germination.
Figure 5.
Figure 5.
Detection of Phenotypic Differences between Mutants and Wild-Type Col-0 Plants. (A) Comparison of leaf initiation between hls1-1 and Col-0. The number of leaves >1 mm were measured on day 14. Data are averages of 40 or >100 plants for hls1-1 and Col-0, respectively. (B) Comparison of shoot growth between fae1-1 and Col-0. Total exposed leaf area was determined via a computerized analysis of digital images of intact rosettes (see Methods). Data are averages of 10 or >100 plants for fae1-1 and Col-0, respectively. (C) Comparison of root growth between adg1-1 and Col-0. Both measurements were taken on day 14 (11 days after transfer to the growth chamber) and represent 20 seedlings grown on two plates. (D) Comparison of silique area and the number of seed per half-silique between adg1-1 and Col-0. Silique area was determined via computerized analysis of digital images of mature filled siliques (see Methods). The number of seed per half-silique was observed after removal of the outer layer of one valve of a mature filled silique. Both measures were averaged from three siliques per plant and are reported as the average of 10 or >300 plants for adg1-1 and Col-0, respectively. (E) Comparison of silique number and yield per plant between adg1-1 and Col-0. The final number of siliques per plant was determined after the completion of flower production (stage 6.90). Yield is reported as the desiccated mass (mg) of seed produced per plant. Data are averages and standard deviations of 10 or >300 plants for adg1-1 or Col-0, respectively. (A) to (C) were obtained in the plate-based assay, and (D) and (E) were obtained in the soil-based assay. Error bars indicate ±sd.

Similar articles

Cited by

References

    1. Chapple, C.C.S., Vogt, T., Ellis, B.E., and Somerville, C.R. (1992). An Arabidopsis mutant defective in the general phenylpropanoid pathway. Plant Cell 4, 1413–1424. - PMC - PubMed
    1. Guzman, P., and Ecker, J.R. (1990). Exploiting the triple response of Arabidopsis to identify ethylene-related mutants. Plant Cell 2, 513–523. - PMC - PubMed
    1. Hartenstein, V. (1993). Atlas of Drosophila Morphology and Development. (Cold Spring Harbor, NY: Cold Spring Harbor Laboratory Press).
    1. James, D.W., Lim, E., Keller, J., Plooy, I., Ralston, E., and Dooner, H.K. (1995). Directed tagging of the Arabidopsis FATTY ACID ELONGATION (FAE1) gene with the maize transposon activator. Plant Cell 7, 309–319. - PMC - PubMed
    1. Krysan, P.J., Young, J.C., and Sussman, M.R. (1999). T-DNA as an insertional mutagen. Plant Cell 11, 2283–2290. - PMC - PubMed

Publication types