

doi: 10.1091/mbc.12.7.2087.
Evidence for the role of MAP1B in axon formation
Affiliations
- PMID: 11452005
- PMCID: PMC55658
- DOI: 10.1091/mbc.12.7.2087
Item in Clipboard
Evidence for the role of MAP1B in axon formation
Mol Biol Cell.
2001 Jul.
Free PMC article
Abstract
Cultured neurons obtained from a hypomorphous MAP1B mutant mouse line display a selective and significant inhibition of axon formation that reflects a delay in axon outgrowth and a reduced rate of elongation. This phenomenon is paralleled by decreased microtubule formation and dynamics, which is dramatic at the distal axonal segment, as well as in growth cones, where the more recently assembled microtubule polymer normally predominates. These neurons also have aberrant growth cone formation and increased actin-based protrusive activity. Taken together, this study provides direct evidence showing that by promoting microtubule dynamics and regulating cytoskeletal organization MAP1B has a crucial role in axon formation.
Figures
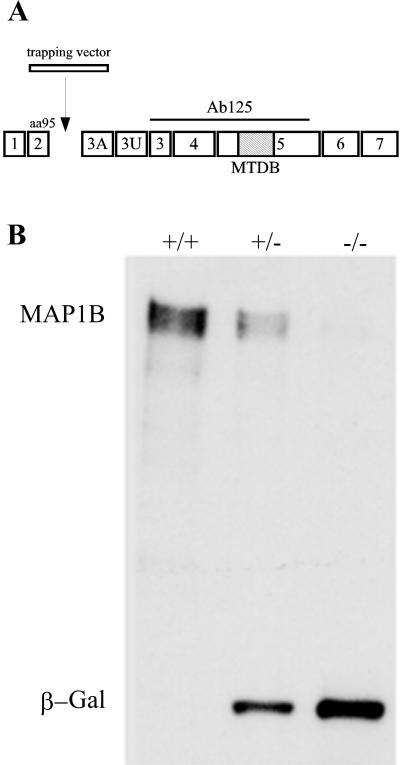
(A) Structure of MAP1B gene. Seven coding exons
(1–7) and two noncoding ones (3A and 3U) of the MAP1B protein are
shown. The trapping vector insertion occurs immediately after exon 2,
which encodes the N-terminal 95 amino acids of the protein. The epitope
of antibody 125 used to confirm the genotype of animals is depicted as
a straight line. The hatched box represents the microtubule-binding
domain (MTBD). (B) Western blot analysis of spinal cord extracts from
wild-type (+/+), heterozygous (+/−), and homozygous (−/−) MAP1B
mutant mice reacted with a mAb against MAP1B and β-galactosidase
(β-Gal). Note that the extracts obtained from the homozygous (−/−)
MAP1B contain trace amounts of MAP1B and high levels of β-Gal. Ten
micrograms of protein was loaded in each lane.
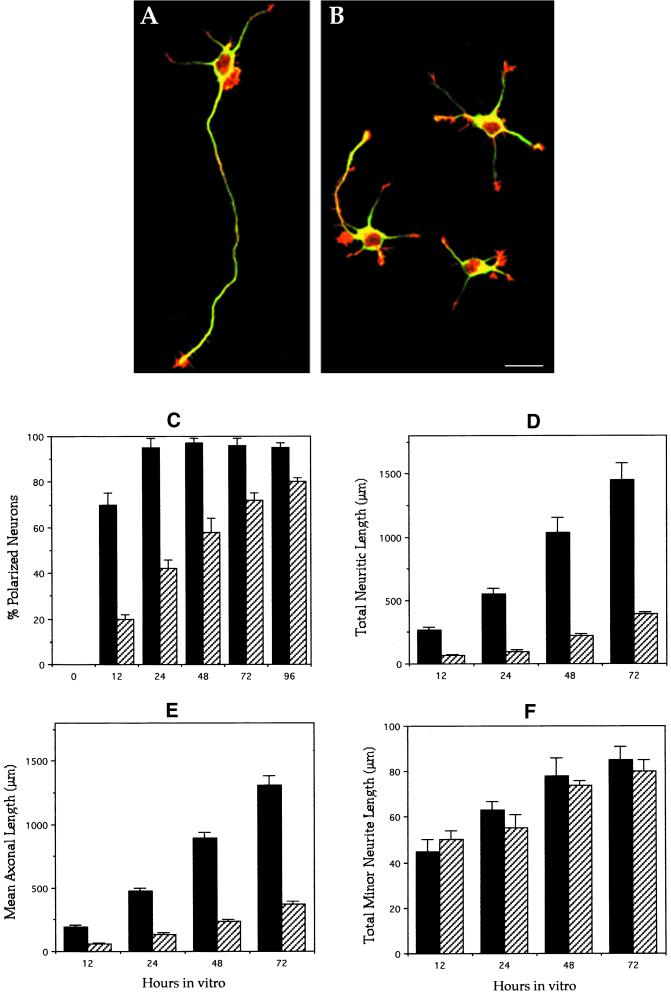
General morphology and morphometric
parameters of control and MAP1B-deficient neurons. (A) Confocal
micrograph showing a polarized hippocampal pyramidal neuron from a
wild-type animal. The cell that displays one single long axon and
several much shorter minor neurites was maintained in culture for
2 d. The cell is double labeled with a mAb against tyrosinated
α-tubulin (green) and rhodamine-phalloidin (red). (B) Confocal
micrograph showing cultured hippocampal pyramidal neurons from a
homozygous (−/−) MAP1B mutant mice. The cells were cultured for
2 d and stained as in B. Note that only one cell is polarized and
displays a very short axon-like neurite. Bar, 20 μm. (C) Graph
showing the percentage of cells displaying axon-like neurites in
cultures from wild-type (▪) and MAP1B-deficient (▨) mice. (D–F)
Graphs showing changes in total neuritic length (D), axonal length (E),
and total minor neuritic length (F) in hippocampal cell cultures from
wild-type (▪) and MAP1B-deficient (▨) mice. Note the significant
and selective decrease of axonal length in the MAP1B-deficient neurons.
Values represent the mean ± SEM.
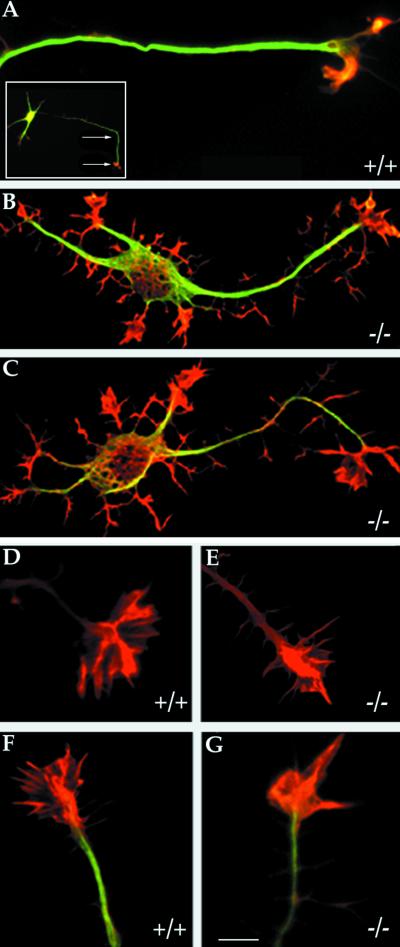
High-resolution analysis of control and
MAP1B-deficient neurons. (A) High-resolution confocal micrograph
showing the distal axonal end of a hippocampal pyramidal neuron from a
WT mouse. A low-power micrograph of the neuron is shown in the inset;
the arrows indicate the distal axonal segment. (B and C) High-resolution confocal micrographs showing the
morphology of cultured hippocampal pyramidal neurons from
MAP1B-deficient mice. The cells (A–C) were double labeled with a mAb
against tyrosinated α-tubulin (green) and rhodamine-phalloidin
(red). Note that MAP1B-deficient neurons display numerous short
filopodial extensions and growth cone-like structures around the cell
body and along neurites. Bar, 5 μm. (D and E) High-power confocal
micrographs showing the morphology of the actin cytoskeleton of axonal
growth cones from wild-type (+/+) and MAP1B-deficient (−/−) neurons
as reveled by staining with rhodamine-phalloidin. (F and G)
Equivalent images to those shown previously but also stained with a mAb
against tyrosinated α-tubulin (green). Note the reduction in the size
of the growth cone lamellipodial veil and the decrease in the number of
radial striations in the mutant neurons. Bar, 5 μm.
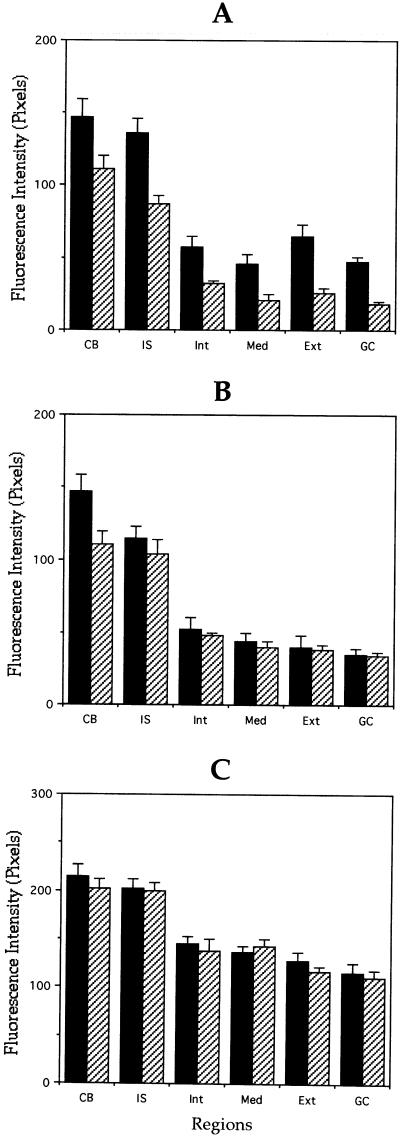
Quantitation of microtubule polymer content of
control and MAP1B-deficient neurons. (A and B) Quantitative
measurements of β-tubulin fluorescence intensity in axons (A) and
minor processes (B) from wild-type (▪) and MAP1B-deficient (▨)
cultured neurons. For these experiments, cells were extracted with
detergents before fixation under microtubule-stabilizing
conditions (see MATERIALS AND METHODS). Fluorescence intensity
measure ments were performed in the cell body (CB) and
along neurites. Within neurites measurements were performed in the
initial segment (IS), inner segment (Int), middle segment (Med),
external segment (Ext), and growth cones (GC) of axons and minor
processes. Note that β-tubulin fluorescence intensity is dramatically
reduced in the external axonal segment and in axonal growth cones (C).
Equivalent measurements to those shown in A, but from cells extracted
with detergents after fixation. Note that there are no significant
differences in fluorescence intensity between WT and MAP1B-deficient
neurons. A total of 75 cells was analyzed for each experimental
condition. Each value represents the mean ± SEM.
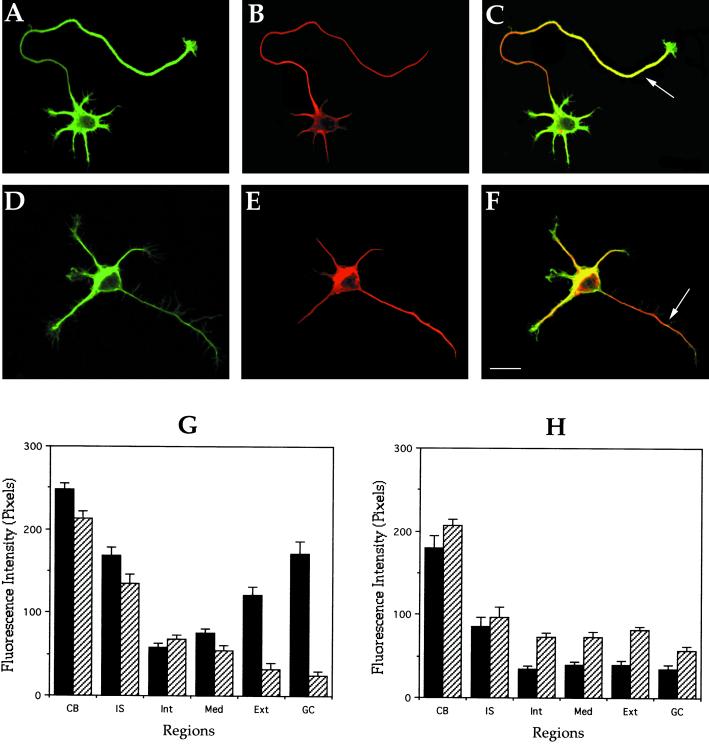
Distribution of stable and dynamic microtubules in
control and MAP1B-deficient neurons. (A and B) Confocal fluorescence
images showing the distribution of tyrosinated (green) and
detyrosinated (red) α-tubulin in a cultured hippocampal pyramidal
neuron from a wild-type animal. (C) Red-green overlay of the images
shown previously. Note that within the axon tyr-tubulin staining
predominates at the distal segment (arrow) and growth cone. (D and E)
Confocal fluorescence images showing the distribution of tyrosinated
(green) and detyrosinated (red) α-tubulin in a cultured hippocampal
pyramidal neuron from a MAP1B-deficient mice. (F) Red-green overlay of
the images shown previously. Note that although the tyr-immunolabeling
decreases along the axon, the one corresponding to detyr-tubulin
increases (arrow). For this experiment, cells were fixed with
detergents under microtubule-stabilizing conditions before fixation.
Bar, 10 μm. (G and H) Quantitative fluorescence measurements of
tyrosinated (▪) and detyrosinated (▨) α-tubulin immunolabeling in
cytoskeletal preparations from cultured hippocampal pyramidal neurons
of wild-type (G) and MAP1B-deficient mice (H). Measurements were
performed in equivalent regions to those described in Figure 4. A total
of 75 cells was analyzed for each experimental condition.
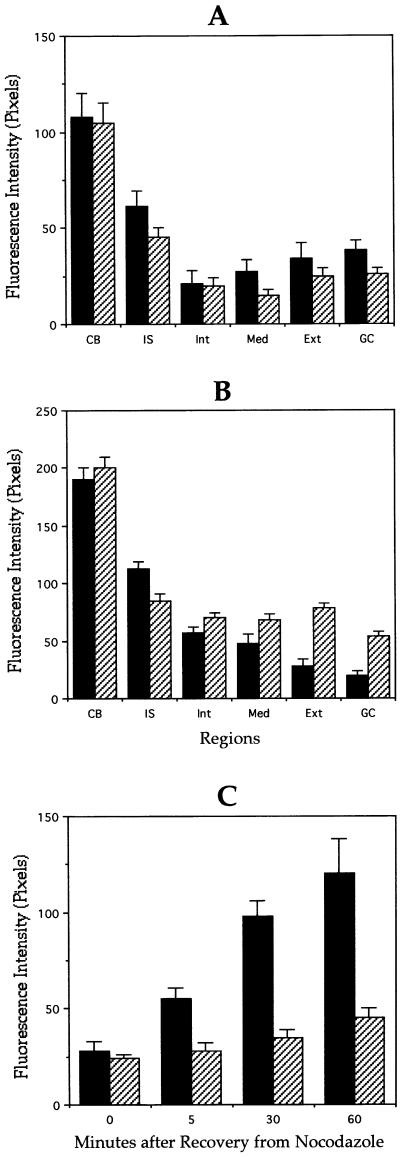
Quantitation of stable and dynamic microtubules in
control and MAP1B-deficient neurons. Quantitative fluorescence
measurements of tyrosinated (A) and detyrosinated (B) α-tubulin
immunolabeling in cytoskeletal preparations from wild-type (▪) or
MAP1B-deficient (▨) cultured hippocampal pyramidal neurons treated
with nocodazole for 5 min. Measurements were performed in equivalent
regions to those described in Figure 4. (C) Quantitative fluorescence measurements of tyrosinated α-tubulin
immunolabeling in cytoskeletal preparations from wild-type (▪) or
MAP1B-deficient (▨) cultured hippocampal pyramidal neurons during
recovery from nocodazole. For this experiment cultured neurons were
treated with nocodazole for 30 min. Fluorescence intensity measurements
were performed at the distal axonal segment. A total of 75 cells was
analyzed for each experimental condition.
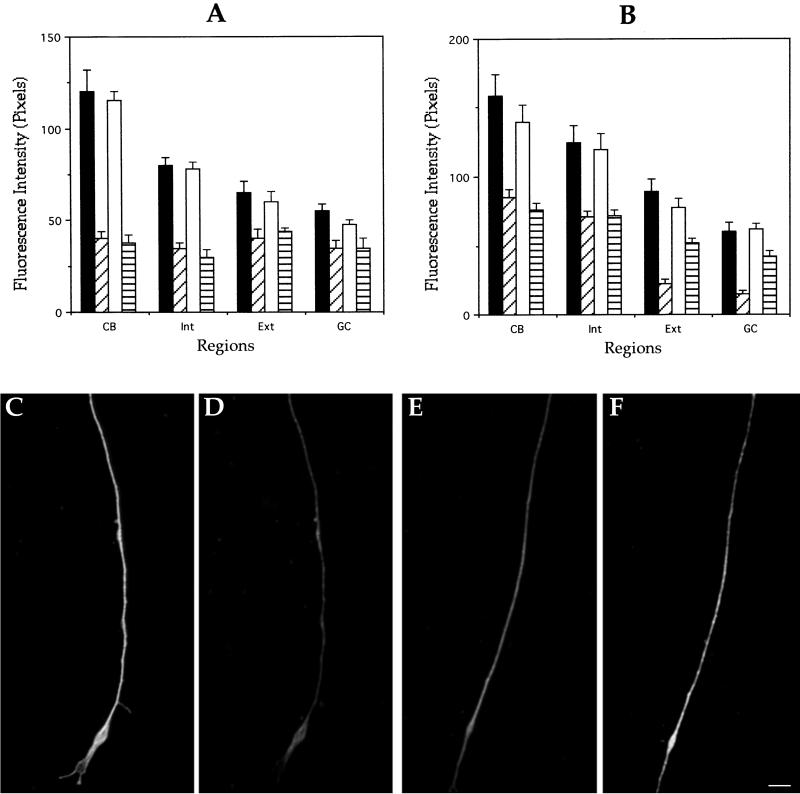
Functional redundancy analysis of control and
MAP1B-deficient neurons. Quantitative fluorescence measurements of tau
(A) and MAP2 (B) immunolabeling from cultured hippocampal pyramidal
neurons of wild-type or MAP1B-deficient neurons. Measurements were
performed in cells fixed prior or after detergent extraction performed
under microtubule-stabilizing conditions. Regions are equivalent to
those of previous figures. Groups: ▪, wild-type neurons fixed before
extraction; ▨, wild-type neurons fixed after extraction; □,
MAP1B-deficient neurons fixed before extraction; and ▤,
MAP1B-deficient neurons fixed after extraction. A total of 75 cells was
analyzed for each experimental condition. (C–F) Double fluorescence
micrographs of cytoskeletal preparations showing β-tubulin (C and E)
and MAP2 (D and F) immunolabeling at the distal axonal third of
wild-type (C and D) or MAP1B-deficient (E and F) neurons. Both axons
were of equivalent length. Bar, 5 μm.
References
-
- Armas-Portela R, Parrales M, Albar J, Martinez A, Avila J. Distribution and characteristics of bII tubulin-enriched microtubules in interphase cells. Exp Cell Res. 1999;248:372–380. - PubMed
-
- Bradke F, Dotti CG. Neuronal polarity: vectorial cytoplasmic flow precedes axon formation. Neuron. 1997;19:1175–1186. - PubMed
Publication types
MeSH terms
Substances
LinkOut - more resources
Full Text Sources
Other Literature Sources
Molecular Biology Databases
