. 2001 Jul 15;29(14):3041-50.
doi: 10.1093/nar/29.14.3041.

Genomic cloning of the Hsc71 gene in the hermaphroditic teleost Rivulus marmoratus and analysis of its expression in skeletal muscle: identification of a novel muscle-preferred regulatory element

Affiliations

Genomic cloning of the Hsc71 gene in the hermaphroditic teleost Rivulus marmoratus and analysis of its expression in skeletal muscle: identification of a novel muscle-preferred regulatory element

J H Park et al. Nucleic Acids Res. .

Abstract

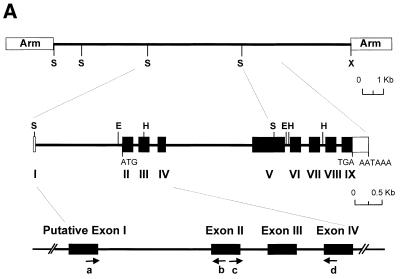
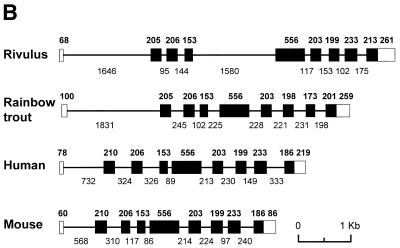
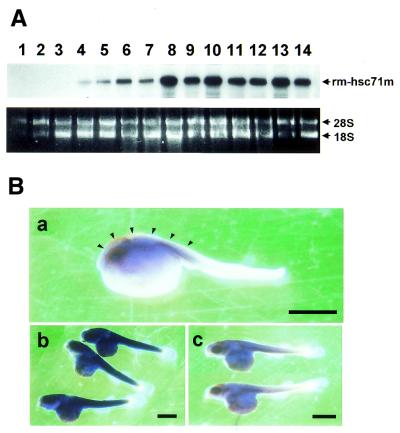
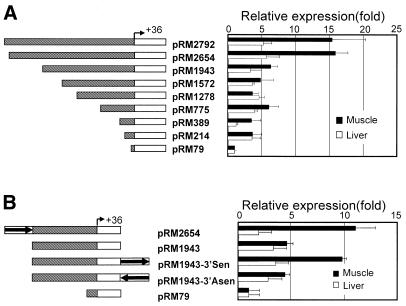
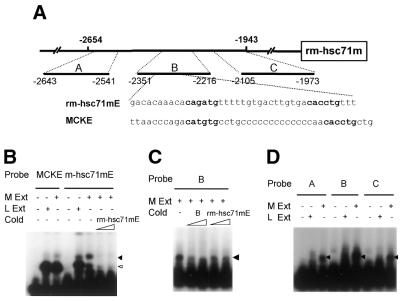
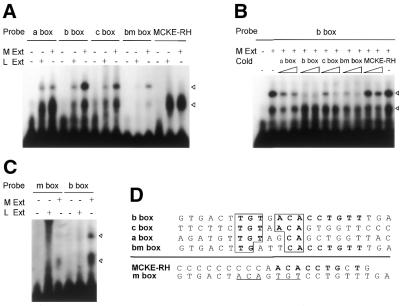
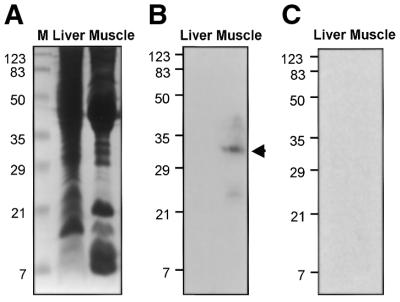
To further our understanding of the role of stress proteins in development as well as in adaptation of fish to adverse environmental conditions, we undertook molecular analyses of stress protein encoding genes from the hermaphroditic teleost Rivulus marmoratus. We isolated a genomic clone containing the Hsc71 gene (rm-hsc71m) and its upstream sequences. rm-Hsc71m is not induced by external stress, but is enriched in a tissue-specific manner during early development. In adult, the strongest expression appeared in skeletal muscle, whereas lower expression was seen in the gill, eye and brain. To understand the regulatory basis of high muscle expression of rm-hsc71m, transfection of R.marmoratus muscle tissue was performed using 5' deletion fragments containing the rm-hsc71m promoter driving EGFP expression. An upstream region from -2.7 to -1.9 kb was identified as a muscle-specific regulatory region. Within this region, we identified at least three sites with the novel sequence TGTnACA interacting with a fish muscle factor having an M(r) of 32 000. Our data indicate that rm-hsc71m expression in skeletal muscle is controlled by a muscle-specific regulatory element containing this novel motif.


Figures

Figure 1
Figure 1
Genomic cloning of the R.marmoratus hsc71 gene. (A) Schematic representation of the restriction map and gene structure of the R.marmoratus hsc71 gene (rm-hsc71m). The open box represents the untranslated exon, whereas the filled boxes are the protein-coding exons. The translation start site (ATG), termination codon (TGA) and poly(A) signal sequences (AATAAA) are also indicated. A putative transcription start site was deduced using CGG genomic analysis web tools. Horizontal arrows with letters represent the location, name and direction of oligonucleotide primers. Vertical upward lines indicate restriction enzyme sites. E, EcoRI; H, HindIII; S, SacI; X, XhoI. (B) Comparison of the rm-hsc71m gene structure to homologous genes from other species. Exons are shown as boxes, in which open boxes represent untranslated regions and introns are indicated as lines between the boxes. The numbers above and below the drawing represent the nucleotide numbers of each exon and intron, respectively. Accession numbers of the sequences are: Rivulus, AF227986; Rainbow trout, S85730; Human, Y00371; Mouse, U73744.
Figure 1
Figure 1
Genomic cloning of the R.marmoratus hsc71 gene. (A) Schematic representation of the restriction map and gene structure of the R.marmoratus hsc71 gene (rm-hsc71m). The open box represents the untranslated exon, whereas the filled boxes are the protein-coding exons. The translation start site (ATG), termination codon (TGA) and poly(A) signal sequences (AATAAA) are also indicated. A putative transcription start site was deduced using CGG genomic analysis web tools. Horizontal arrows with letters represent the location, name and direction of oligonucleotide primers. Vertical upward lines indicate restriction enzyme sites. E, EcoRI; H, HindIII; S, SacI; X, XhoI. (B) Comparison of the rm-hsc71m gene structure to homologous genes from other species. Exons are shown as boxes, in which open boxes represent untranslated regions and introns are indicated as lines between the boxes. The numbers above and below the drawing represent the nucleotide numbers of each exon and intron, respectively. Accession numbers of the sequences are: Rivulus, AF227986; Rainbow trout, S85730; Human, Y00371; Mouse, U73744.
Figure 2
Figure 2
Expression of the rm-hsc71m gene is modulated during early development. (A) Expression of rm-hsc71m during early development. Total RNAs were prepared from developing embryos or larvae at each stage of development (n = 3–10) and used to monitor the level of rm-hsc71m expression by RT–PCR using a set of rm-hsc71m-specific primers in exon II and exon IV, respectively (rm-hsc71m primer c/d in Table 1). Staging of embryos was determined by the criteria of Harrington (34). As a loading control, photographs of ethidium bromide-stained 28S and 18S rRNA are also shown in the lower panel. Lane 1, unfertilized eggs; lane 2, blastula embryos; lane 3, 2-day-old embryos; lanes 4–12, 6- to 14-day-old embryos; lane 13, hatched larvae; lane 14, juvenile stage larvae. (B) Lateral views of a whole-body of a 3-day-old (a) and a 13-day-old embryo (b) showing spatial expression patterns of rm-hsc71m detected by whole-mount in situ hybridization with an antisense RNA probe containing a 414 base sequences corresponding to exons II–IV of rm-hsc71m (see Materials and Methods). Control 13-day-old embryos (c) were hybridized with a sense probe. High expression of rm-hsc71m in the head-fold and trunk region is marked by an arrowhead. Bar, 100 µm.
Figure 3
Figure 3
rm-hsc71m expression is differentially regulated in a tissue-specific manner. (A) Expression profile of rm-hsc71m in adult tissues. Total RNAs were isolated from several organs of a 1-year-old fish and subjected to RT–PCR analysis using a set of rm-hsc71m-specific primers as described in the legend to Figure 2A. The lower panel shows photographs of ethidium bromide-stained 28S and 18S rRNAs as a loading control. (B) Views of paraffin-sectioned 1-year-old fish showing spatial expression patterns of rm-hsc71m detected by in situ hybridization with antisense RNA probes as described in Figure 2B. Sections were stained with hematoxylin/eosin (a, d, f and h) or hybridized with an antisense (b, e, g and i) rm-hsc71m RNA probe. As a negative hybridization control, a sense rm-hsc71m RNA probe was also employed (c). Arrows indicate regions showing strong expression of rm-hsc71m (open arrows in panels e, g and i indicate skeletal muscle tissue showing the strongest expression). B, brain; CL, cerebellum (corpus cerebelli); E, esophagus; GF, gill filament; I, infundibulum; L, liver; MO, medulla oblongata; O, oral cavity; OL, olfactory lobe (telencephalon); ON, optic nerve; OT, optic tectum; S, spine; SK, skeletal muscle. Scale bars: a–c, 1.25 µm; d–i, 0.32 µm.
Figure 4
Figure 4
Identification of a muscle-specific regulatory region in rm-hsc71m upstream sequences. (A) Examination of the activity of 5′-upstream sequences in muscle based on reporter activity. Schematic drawings of a series of 5′-deletion constructs containing the EGFP reporter gene flanked by variable lengths of rm-hsc71m 5′-upstream sequences, which are shown on the left side. The relative levels of reporter gene expression in liver and muscle tissues are shown on the right side. The constructs were transiently co-transfected into cultured Rivulus muscle or liver tissue, along with a pCMV-lacZ control vector. The level of EGFP expression was monitored 48 h after transfection by RT–PCR. Transfection efficiency was normalized to the level of lacZ expression. In all cases, EGFP/lacZ values obtained from at least two different plasmid preparations and three experiments were normalized to that of the basal construct (pRM79 containing only a TATA box). (B) Position- or orientation-dependency of the rMME. Reporter constructs containing the rMME (1.2 kb PvuII fragment from –2617 to –1418 bp of rm-hsc71m) downstream of the EGFP reporter in a sense or antisense orientation were transiently transfected into cultured muscle or liver tissue. Schematic drawings of each construct and their relative expression levels are shown in the left and right panels, respectively.
Figure 5
Figure 5
Identification of muscle-specific binding activity in the rMME of rm-hsc71m. (A) Schematic representation of the rMME (from –2654 to –1943) of rm-hsc71m is shown. Three putative muscle-specific factor-binding sub-elements identified by a DNASIS program were designated A, B and C, respectively. The rm-hsc71mE element represents sequences similar to those seen in the MCKE. (B) Electrophoretic mobility shift assay shows muscle-enriched rm-hsc71mE binding activity distinct from MCKE binding activity. A gel mobility shift assay was performed using a MCKE or an rm-hsc71mE probe in the presence of rivulus muscle or liver S150 extracts to assay for muscle-specific rm-hsc71mE binding activity. To determine the specificity of rm-hsc71mE binding activity, molar excess amounts of cold rm-hsc71mE competitor (10× and 50×) were included in the reaction. Filled and unfilled arrowheads show specific and non-specific binding activities, respectively. (C) A single predominant rm-hsc71mE binding activity exists in the B region. To look for additional binding activities in the B region, the B fragment was used as a probe in a gel shift assay in the presence of Rivulus muscle S150 extracts. To determine the specificity of binding, 10× or 50× molar excess amounts of cold competitor, B or rm-hsc71mE, were added during the assay. The arrowhead indicates the shifted binding activity. (D) Regions A and C also show muscle-specific binding activity similar to rm-hsc71mE binding activity in the B region. To determine whether muscle-specific DNA binding activities exist in A and C regions, probe DNAs prepared from A and C regions were used in gel shift assays containing Rivulus muscle or liver S150 extracts. The arrowhead indicates a shifted band.
Figure 6
Figure 6
A novel muscle-specific factor is responsible for recognition of TGTnACA sequences in all three 5′-distal sub-elements of the rMME of rm-hsc71m. (A) Electrophoretic mobility shift analysis showing binding specificity of a novel muscle-specific factor to rm-hsc71mE-related sequences in each sub-region of the rMME of rm-hsc71m. The rm-hsc71mE-related sequences in each region (a box, b box and c box, respectively; see panel D for each sequence) were identified by a computer search. The bm box is derived from the b box with three base changes. The MCKE-RH is the right half E-box in the MCKE (see Table 1). Each box was used as a probe in a gel shift analysis containing Rivulus muscle or liver S150 extracts. Specific and non-specific bands are marked by filled and unfilled arrowheads, respectively. (B) Competitive electrophoretic gel mobility shift analysis showing the relative binding affinity of the muscle-specific factor to each box. Increasing amounts (0, 10× and 50×) of a molar excess of cold competitor were added to the reaction containing the b box probe and Rivulus muscle S150 extracts. Specific and non-specific bands are marked by filled and unfilled arrowheads, respectively. (C) Electrophoretic mobility shift analysis showing that the central TGTnACA sequences are critical for muscle-specific factor binding. A double-stranded mutant oligonucleotide (m box; see panel D) in which all of the central conserved sequences of b box were altered (TGTGACAACAGTGT) was used as probe, along with parent b box probe, containing Rivulus muscle and liver S150 extracts. (D) Comparison of sequences recognized by a muscle-specific factor (only a top strand of sequences is shown: a, b and c boxes corresponded to sequences from –2627 to –2606, from –2296 to –2275 and from –2009 to –1988, respectively). Consensus binding bases are indicated as a boldface letter in a box. Boldface letters indicate homologous sequences in the MCKE-RH and the b box, and the underlined sequences in the m box indicate mutagenized bases from the b box.
Figure 7
Figure 7
Identification of the TGTnACA box-binding protein in Mangrove rivulus muscle by southwestern blotting. S150 extracts from Mangrove rivulus liver and muscle tissues were subjected to SDS–PAGE and either stained with Coomassie brilliant blue (A) and filter-hybridized with an [α-32P]dCTP-labeled b box probe (B) or m box probe (C) after electroblotting to the membrane. An arrow indicates a specific protein band hybridized with the probe DNA. Prestained protein molecular weight markers (Bio-Rad) were also electrophoresed in an adjacent lane.

Similar articles

Cited by

References

    1. Morimoto R.I., Tissieres,A. and Georgopoulos,C. (1994) The Biology of Heat Shock Proteins and Molecular Chaperones. Cold Spring Harbor Laboratory Press, Cold Spring Harbor, NY.
    1. Feder M.E. and Hofmann,G.E. (1999) Heat-shock proteins, molecular chaperones, and the stress response: evolutionary and ecological physiology. Annu. Rev. Physiol., 61, 243–282. - PubMed
    1. Sorger P.K. (1991) Heat shock factor and the heat shock response. Cell, 65, 363–366. - PubMed
    1. Boorstein W.R., Ziegelhoffer,T. and Craig,E.A. (1994) Molecular evolution of the HSP70 multigene family. J. Mol. Evol., 38, 1–17. - PubMed
    1. Loones M.T. and Morange,M. (1998) Hsp and chaperone distribution during endochondral bone development in mouse embryo. Cell. Stress Chaperones, 3, 237–244. - PMC - PubMed

Publication types

MeSH terms

Associated data