Comparative Study
. 2001 Jul;103(3):281-90.
doi: 10.1046/j.1365-2567.2001.01248.x.

Systematic characterization of human CD8+ T cells with natural killer cell markers in comparison with natural killer cells and normal CD8+ T cells

Affiliations
Comparative Study

Systematic characterization of human CD8+ T cells with natural killer cell markers in comparison with natural killer cells and normal CD8+ T cells

T Ohkawa et al. Immunology. 2001 Jul.

Abstract

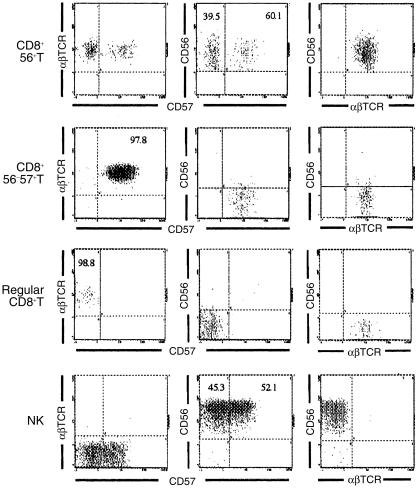
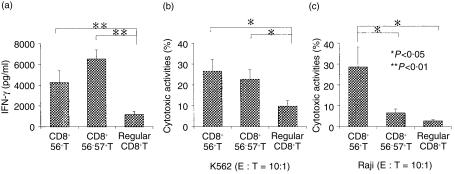
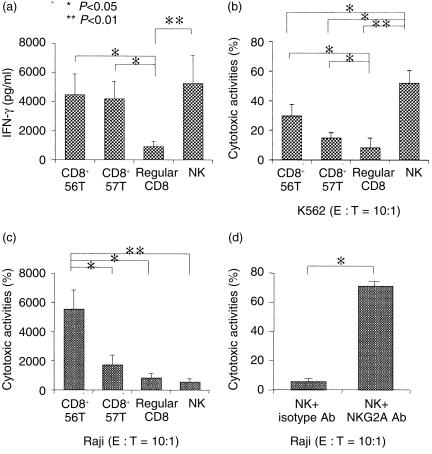
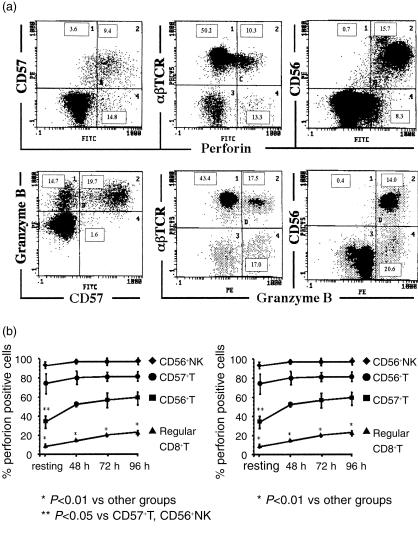
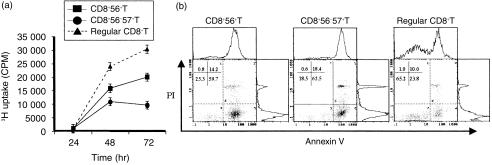
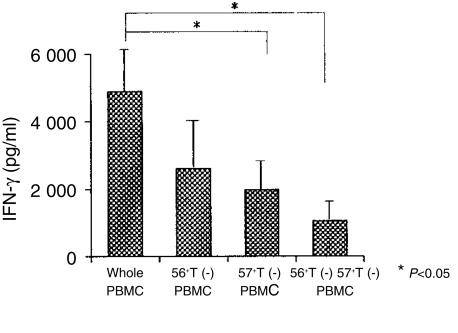
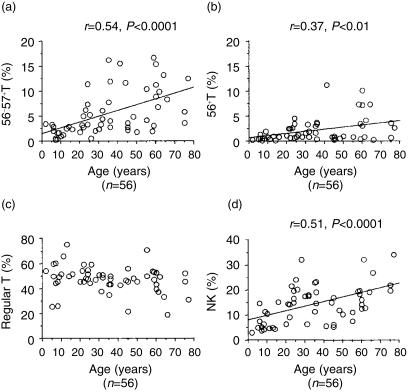
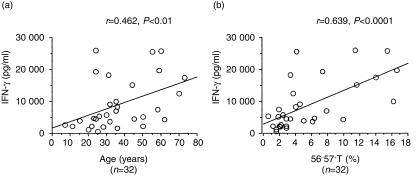
We investigated the function of CD56+ CD8+ T cells (CD56+ T cells) and CD56- CD57+ CD8+ T cells (CD57+ T cells; natural killer (NK)-type T cells) and compared them with those of normal CD56- CD57- CD8+ T cells (CD8+ T cells) and CD56+ NK cells from healthy volunteers. After the stimulation with immobilized anti-CD3 antibodies, both NK-type T cells produced much larger amounts of interferon-gamma (IFN-gamma) than CD8+ T cells. Both NK-type T cells also acquired a more potent cytotoxicity against NK-sensitive K562 cells than CD8+ T cells while only CD56+ T cells showed a potent cytotoxicity against NK-resistant Raji cells. After the stimulation with a combination of interleukin (IL)-2, IL-12 and IL-15, the IFN-gamma amounts produced were NK cells > or = CD56+ T cells > or = CD57+ T cells > CD8+ T cells. The cytotoxicities against K562 cells were NK cells > CD56+ T cells > or = CD57+ T cells > CD8+ T cells while cytotoxicities against Raji cells were CD56+ T cells > CD57+ T cells > or = CD8+ T cells > or = NK cells. However, the CD3-stimulated proliferation of both NK-type T cells was smaller than that of CD8+ T cells partly because NK-type T cells were susceptible to apoptosis. In addition to NK cells, NK-type T cells but not CD8+ T cells stimulated with cytokines, expressed cytoplasmic perforin and granzyme B. Furthermore, CD3-stimulated IFN-gamma production from peripheral blood mononuclear cells (PBMC) correlated with the proportions of CD57+ T cells in PBMC from donors. Our findings suggest that NK-type T cells play an important role in the T helper 1 responses and the immunological changes associated with ageing.


Figures

Figure 1
Figure 1
A phenotypic profile and the purity of each sorted lymphocyte subset. The numbers in each profile indicate the percentages of cells within indicated quadrants.
Figure 2
Figure 2
CD3-stimulated IFN-γ production and antitumour cytotoxicity in the T cell subsets. (a) IFN-γ production. Each purified T-cell population was stimulated with anti-CD3 antibody for 48 hr and the IFN-γ levels of the culture supernatants were subjected to ELISA. (b) Cytotoxic activity against K562 cells. (c) Cytotoxic activity against Raji cells. Each purified cell population was stimulated with anti-CD3 antibody for 4 days and cytotoxic assays were performed. All data represented are the means± SE from eight independent experiments.
Figure 3
Figure 3
Cytokine-stimulated IFN-γ production and antitumour cytotoxicity in various lymphocyte subsets, and enhancement of the cytotoxicity against Raji cells by blocking NKG2A. (a) IFN-γ production. Each purified population was stimulated with a combination of IL-2, IL-12 and IL-15 for 48 hr and IFN-γ levels of the culture supernatants were subjected to ELISA. Cytotoxic activity against K562 cells (b) or Raji cells (c). Each purified cell population was stimulated with cytokines for 4 days and cytotoxic assays were performed. All data represented are the means± SE from five to eight independent experiments. (d) The augmentation of the cytotoxicity against Raji cells of cytokine-stimulated NK cells by blocking NKG2A. Purified NK cells were cultured for 4 days and incubated with NKG2A antibody (200 µg/ml) (mouse IgG2b antibody as a control) at 4° for 10 min and washed twice and then cytotoxic assays were performed. The data represented are the means± SE from four independent experiments.
Figure 4
Figure 4
The expression of cytoplasmic perforin and granzyme B in NK cells and both NK-type T cells after cytokine stimulation. (a) 72 hr after stimulation of PBMC with a combination of IL-2, IL-12 and IL-15, either cytoplasmic perforin or granzyme B of CD57+ cells, CD56+ cells and normal CD8+ cells were examined. (b) A time course analysis of the proportion of either cytoplasmic perforin- or granzyme-B-expressing cells in each lymphocyte subset. By gating each subset in the three-colour flow cytometric analysis, the percentage of perforin- or granzyme-B-positive cells in each subset was examined after cytokine stimulation at the indicated time points (n = 4).
Figure 5
Figure 5
CD3-stimulated proliferation and apoptosis of each T-cell subset. Each T-cell population was stimulated with immobilized anti-CD3 antibody for the indicated hours and the cells were pulsed with [3H]thymidine for 12 hr before the cells were harvested (a). Representative results are shown from repeated experiments with similar results. Each T-cell population was stimulated for 48 hr and stained with propidium iodide (PI) and FITC–annexin V and then was analysed by flow cytometry (b). Representative results were shown from repeated experiments with similar results.
Figure 6
Figure 6
NK-type T cells as a major source for the production of IFN-γ in CD3-stimulated PBMC. NK-type T-cell-depleted PBMC were cultured with anti-CD3 antibody for 48 hr and their IFN-γ production capacities were compared with those of whole PBMC. All data represented are the means ± SE from four independent experiments.
Figure 7
Figure 7
The proportions of NK cells and NK-type T cells increase proportionally with age. The data are based on the PBMC obtained from 56 individuals.
Figure 8
Figure 8
The IFN-γ production capacity of PBMC correlates either with the age or the proportion of CD57+ T cells. The data are based on the findings of several independent experiments from 32 individuals.
Figure 9
Figure 9
T-cell receptor β repertoire of CD56+ T cells, CD57+ T cells and normal CD8+ T cells.PBMC from four individual healthy volunteers were stained as described in Materials and Methods. % of Vβ T cells in CD56+ T cells = (% CD56+ Vβ T cells/% CD56+ αβ T cells) × 100; % of Vβ T cells in CD57+ T cells = (% CD56 CD57+ Vβ T cells/% CD56 CD57+ αβ T cells) × 100; % Vβ T cells in CD56 CD57 αβ T cells (normal CD8+ T cells) = (% CD56 CD57 Vβ T cells/% CD56 CD57 αβ T cells) × 100.

Similar articles

Cited by

References

    1. Abo T, Balch CM. A differentiation antigen of human NK and K cells identified by a monoclonal antibody (HNK-1) J Immunol. 1981;127:1024–9. - PubMed
    1. Lanier LL, Le AM, Civin CI, Loken MR, Phillips JH. The relationship of CD16 (Leu-11) and Leu-19 (NKH-1) antigen expression on human peripheral blood NK cells and cytotoxic T lymphocytes. J Immunol. 1986;136:4480–6. - PubMed
    1. Lanier LL, Testi R, Bindl J, Phillips JH. Identity of Leu-19 (CD56) leukocyte differentiation antigen and neural cell adhesion molecule. J Exp Med. 1989;169:2233–8. - PMC - PubMed
    1. Kruse J, Mailhammer R, Wernecke H, Faissner A, Sommer I, Goridis C, Schachner M. Neural cell adhesion molecules and myelin-associated glycoprotein share a common carbohydrate moiety recognized by monoclonal antibodies L2 and HNK-1. Nature. 1984;311:153–5. - PubMed
    1. Abo T, Watanabe H, Iiai T, et al. Extrathymic pathways of T-cell differentiation in the liver and other organs. Int Rev Immunol. 1994;11:61–102. - PubMed

Publication types

MeSH terms