Characterization of self-T-cell response and antigenic determinants of U1A protein with bone marrow-derived dendritic cells in NZB x NZW F1 mice
- PMID: 11454059
- PMCID: PMC1783246
- DOI: 10.1046/j.1365-2567.2001.01255.x
Characterization of self-T-cell response and antigenic determinants of U1A protein with bone marrow-derived dendritic cells in NZB x NZW F1 mice
Abstract
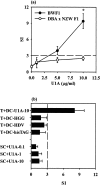
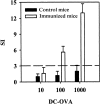
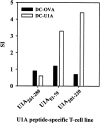
Systemic lupus erythematosus (SLE) is characterized by the existence of a heterogeneous group of autoantibodies directed against nuclear intact structures, such as nucleosomes and small nuclear ribonucleoproteins (snRNPs). Autoantibodies against snRNPs are of special interest because they are detectable in the majority of SLE patients. Although the B-cell antigenic determinants have been well characterized, very limited data have been reported in regard to the T-cell epitopes of snRNPs. Furthermore, several studies have demonstrated that determination of the auto-T-cell epitopes recognized by freshly isolated T cells is difficult from unprimed lupus mice when self-antigen-pulsed B cells or macrophages are used as antigen-presenting cells (APCs) in vitro. In the present study, we showed a novel approach for determining the auto-T-cell epitopes, using bone marrow-derived dendritic cells (BMDCs) pulsed with the murine U1A protein - an immunodominant antigen of the U1 snRNPs - which is capable of activating freshly isolated T cells from unprimed (NZB x NZW) F1 (BWF1) mice in vitro. The T-cell epitope area was found to be located at the C-terminus of U1A, overlapping the T-cell epitope of human U1A that has been reported in human SLE. Identification of the autoreactive T-cell epitope(s) in snRNPs will help to elucidate how reciprocal T-B determinant spreading of snRNPs emerges in lupus. The results presented here also indicate that it is feasible to use this approach to further explore strategies to design immunotherapy for patients with lupus.
Figures


Similar articles
-
Identification of T-cell epitopes on U1A protein in MRL/lpr mice: double-negative T cells are the major responsive cells.Immunology. 2005 Jun;115(2):279-86. doi: 10.1111/j.1365-2567.2005.02139.x. Immunology. 2005. PMID: 15885135 Free PMC article.
-
In vivo tolerance breakdown with dendritic cells pulsed with U1A protein in non-autoimmune mice: the induction of a high level of autoantibodies but not renal pathological changes.Immunology. 2002 Jul;106(3):326-35. doi: 10.1046/j.1365-2567.2002.01438.x. Immunology. 2002. PMID: 12100720 Free PMC article.
-
Treatment of murine lupus using nucleosomal T cell epitopes identified by bone marrow-derived dendritic cells.Arthritis Rheum. 2004 Oct;50(10):3250-9. doi: 10.1002/art.20520. Arthritis Rheum. 2004. PMID: 15476240
-
Anti-nucleosome antibodies and T-cell response in systemic lupus erythematosus.Ann Med Interne (Paris). 2002 Dec;153(8):513-9. Ann Med Interne (Paris). 2002. PMID: 12610425 Review.
-
Reciprocal T-B determinant spreading develops spontaneously in murine lupus: implications for pathogenesis.Immunol Rev. 1998 Aug;164:201-8. doi: 10.1111/j.1600-065x.1998.tb01221.x. Immunol Rev. 1998. PMID: 9795777 Review.
Cited by
-
The detailed analysis of the changes of murine dendritic cells (DCs) induced by thymic peptide: pidotimod(PTD).Hum Vaccin Immunother. 2012 Sep;8(9):1250-8. doi: 10.4161/hv.20579. Epub 2012 Aug 6. Hum Vaccin Immunother. 2012. PMID: 22863756 Free PMC article.
-
Shikonin inhibits maturation of bone marrow-derived dendritic cells and suppresses allergic airway inflammation in a murine model of asthma.Br J Pharmacol. 2010 Dec;161(7):1496-511. doi: 10.1111/j.1476-5381.2010.00972.x. Br J Pharmacol. 2010. PMID: 20735407 Free PMC article.
-
Mesangial cells of lupus-prone mice are sensitive to chemokine production.Arthritis Res Ther. 2007;9(4):R67. doi: 10.1186/ar2226. Arthritis Res Ther. 2007. PMID: 17617918 Free PMC article.
-
Importance of spliceosomal RNP1 motif for intermolecular T-B cell spreading and tolerance restoration in lupus.Arthritis Res Ther. 2007;9(5):R111. doi: 10.1186/ar2317. Arthritis Res Ther. 2007. PMID: 17963484 Free PMC article.
-
Effect of an exogenous trigger on the pathogenesis of lupus in (NZB x NZW)F1 mice.Arthritis Rheum. 2002 Aug;46(8):2235-44. doi: 10.1002/art.10441. Arthritis Rheum. 2002. PMID: 12209530 Free PMC article.
References
-
- Tan EM. Autoantibodies and autoimmunity: a three-decade perspective. A tribute to Henry G. Kunkel. Ann N Y Acad Sci. 1997;815:1–14. - PubMed
-
- Steinberg AD, Krieg AM, Gourley MF, Klinman DM. Theoretical and experimental approaches to generalized autoimmunity. Immunol Rev. 1990;118:129–63. - PubMed
-
- Fatenejad S, Brooks W, Schwartz A, Craft J. Pattern of anti-small nuclear ribonucleoprotein antibodies in MRL/Mp-lpr/lpr mice suggests that the intact U1 snRNP particle is their autoimmunogenic target. J Immunol. 1994;152:5523–31. - PubMed
Publication types
MeSH terms
Substances
LinkOut - more resources
Full Text Sources
Medical
Miscellaneous

