Calmodulin protects cells from death under normal growth conditions and mitogenic starvation but plays a mediating role in cell death upon B-cell receptor stimulation
- PMID: 11454062
- PMCID: PMC1783242
- DOI: 10.1046/j.1365-2567.2001.01259.x
Calmodulin protects cells from death under normal growth conditions and mitogenic starvation but plays a mediating role in cell death upon B-cell receptor stimulation
Erratum in
- Immunology 2001 Sep;104(1):118
Abstract
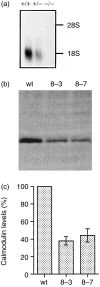
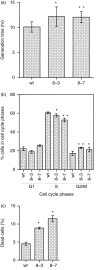
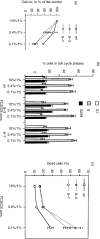
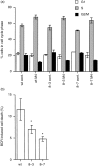
Calmodulin (CaM) is the main intracellular Ca2+ sensor protein responsible for mediating Ca2+ triggered processes. Chicken DT40 lymphoma B cells express CaM from the two genes, CaMI and CaMII. Here we report the phenotypes of DT40 cells with the CaMII gene knocked out. The disruption of the CaMII gene causes the intracellular CaM level to decrease by 60%. CaMII-/- cells grow more slowly and die more frequently as compared to wild type (wt) cells but do not exhibit significant differences in their cell cycle profile. Both phenotypes are more pronounced at reduced serum concentrations. Upon stimulation of the B-cell receptor (BCR), the resting Ca2+ levels remain elevated after the initial transient in CaMII-/- cells. Despite higher Ca2+ resting levels, the CaMII-/- cells are partially protected from BCR induced apoptosis indicating that CaM plays a dual role in apoptotic processes.
Figures


Similar articles
-
Analysis of B-cell signaling using DT40 B-cell line.Methods Mol Biol. 2004;271:261-70. doi: 10.1385/1-59259-796-3:261. Methods Mol Biol. 2004. PMID: 15146126
-
BCR signals target p27(Kip1) and cyclin D2 via the PI3-K signalling pathway to mediate cell cycle arrest and apoptosis of WEHI 231 B cells.Oncogene. 2001 Nov 1;20(50):7352-67. doi: 10.1038/sj.onc.1204951. Oncogene. 2001. PMID: 11704865
-
Protein tyrosine kinases p53/56lyn and p72syk in MHC class I-mediated signal transduction in B lymphoma cells.Exp Cell Res. 1998 Apr 10;240(1):144-50. doi: 10.1006/excr.1998.4014. Exp Cell Res. 1998. PMID: 9570929
-
Regulation of B-cell fate by antigen-receptor signals.Nat Rev Immunol. 2002 Dec;2(12):945-56. doi: 10.1038/nri955. Nat Rev Immunol. 2002. PMID: 12461567 Review.
-
Effects of changes in calmodulin levels on cell proliferation.Environ Health Perspect. 1990 Mar;84:31-4. doi: 10.1289/ehp.908431. Environ Health Perspect. 1990. PMID: 2190816 Free PMC article. Review.
Cited by
-
Ca(2+) signaling, genes and the cell cycle.Cell Calcium. 2010 Nov;48(5):243-50. doi: 10.1016/j.ceca.2010.10.003. Epub 2010 Nov 16. Cell Calcium. 2010. PMID: 21084120 Free PMC article. Review.
-
Significance of calcium binding, tyrosine phosphorylation, and lysine trimethylation for the essential function of calmodulin in vertebrate cells analyzed in a novel gene replacement system.J Biol Chem. 2012 May 25;287(22):18173-81. doi: 10.1074/jbc.M112.339382. Epub 2012 Apr 6. J Biol Chem. 2012. PMID: 22493455 Free PMC article.
-
Regulation of the ligand-dependent activation of the epidermal growth factor receptor by calmodulin.J Biol Chem. 2012 Jan 27;287(5):3273-81. doi: 10.1074/jbc.M111.317529. Epub 2011 Dec 8. J Biol Chem. 2012. PMID: 22157759 Free PMC article.
-
The Arrhythmogenic Calmodulin Mutation D129G Dysregulates Cell Growth, Calmodulin-dependent Kinase II Activity, and Cardiac Function in Zebrafish.J Biol Chem. 2016 Dec 23;291(52):26636-26646. doi: 10.1074/jbc.M116.758680. Epub 2016 Nov 4. J Biol Chem. 2016. PMID: 27815504 Free PMC article.
References
-
- Carafoli E, Klee CB. Calcium as a Cellular Regulator. New York: Oxford University Press; 1999.
-
- Van Eldik L, Watterson DM. Calmodulin Signal Trandsduction. San Diego: Academic Press; 1999.
-
- James P, Vorherr T, Carafoli E. Calmodulin-binding domains: just two faced or multi-faceted? Trends Biochem Sci. 1995;20:38–42. 10.1016/s0968-0004(00)88949-5. - DOI - PubMed
-
- Davis TN, Urdea MS, Masiarz FR, Thorner J. Isolation of the yeast calmodulin gene: calmodulin is an essential protein. Cell. 1986;47:423–31. - PubMed
Publication types
MeSH terms
Substances
LinkOut - more resources
Full Text Sources
Miscellaneous

