. 2001 Aug;49(2):241-50.
doi: 10.1136/gut.49.2.241.

Arginine induced acute pancreatitis alters the actin cytoskeleton and increases heat shock protein expression in rat pancreatic acinar cells

Affiliations

Arginine induced acute pancreatitis alters the actin cytoskeleton and increases heat shock protein expression in rat pancreatic acinar cells

M Tashiro et al. Gut. 2001 Aug.

Abstract

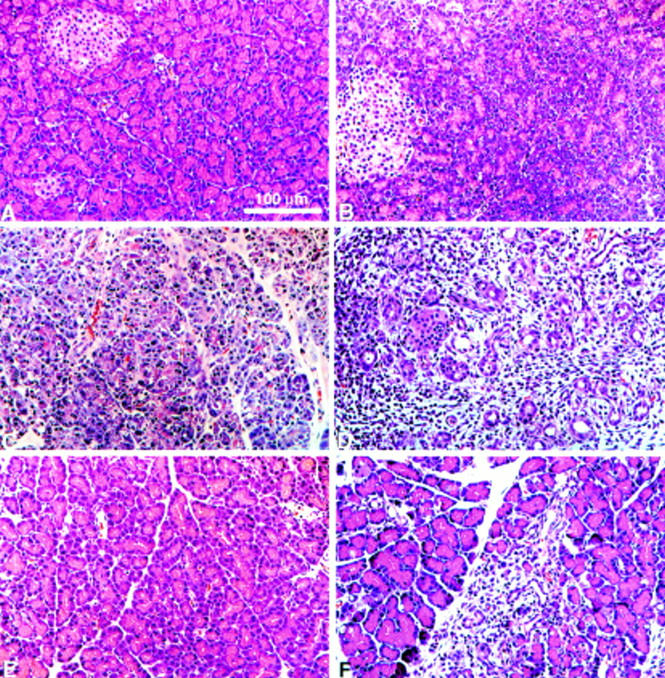
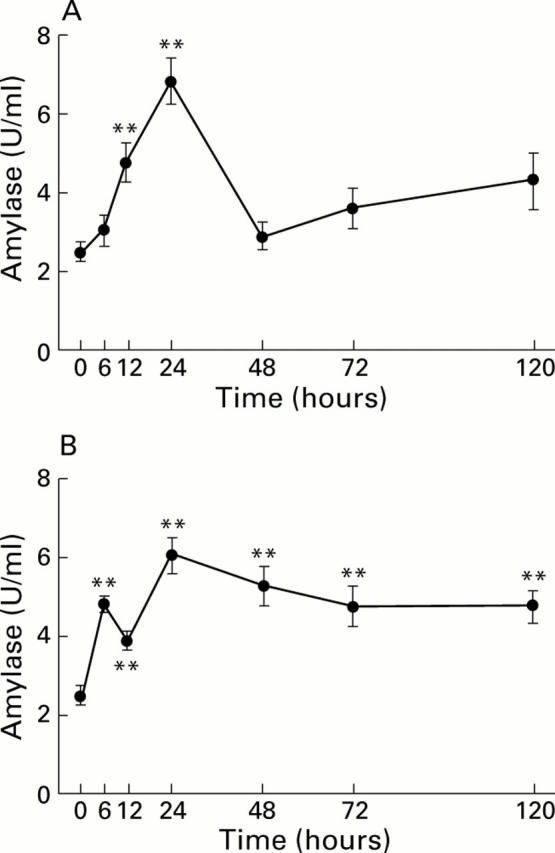
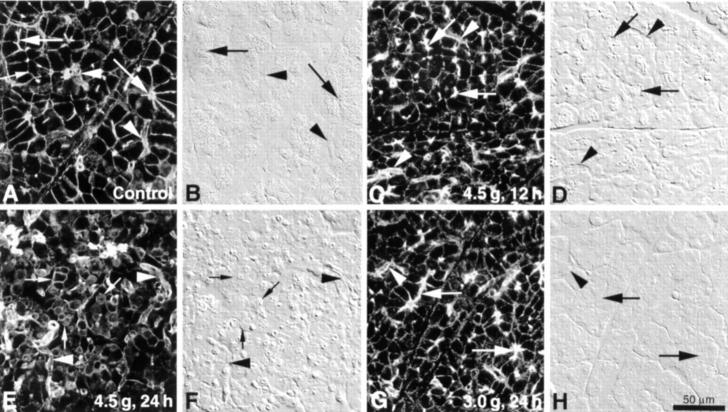
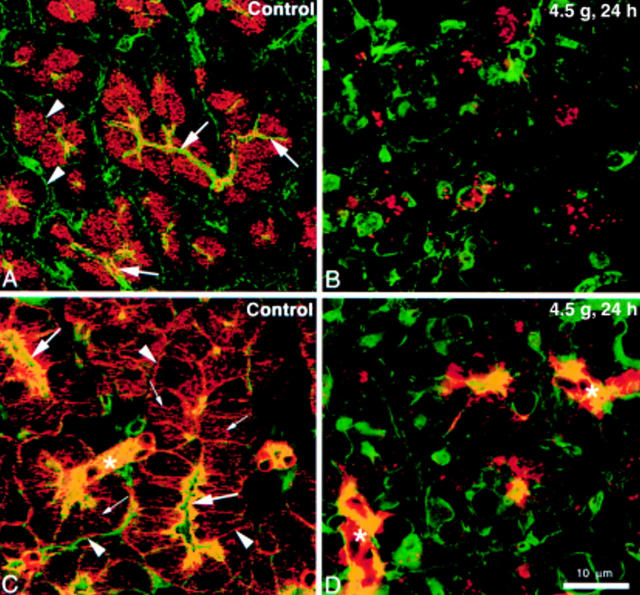
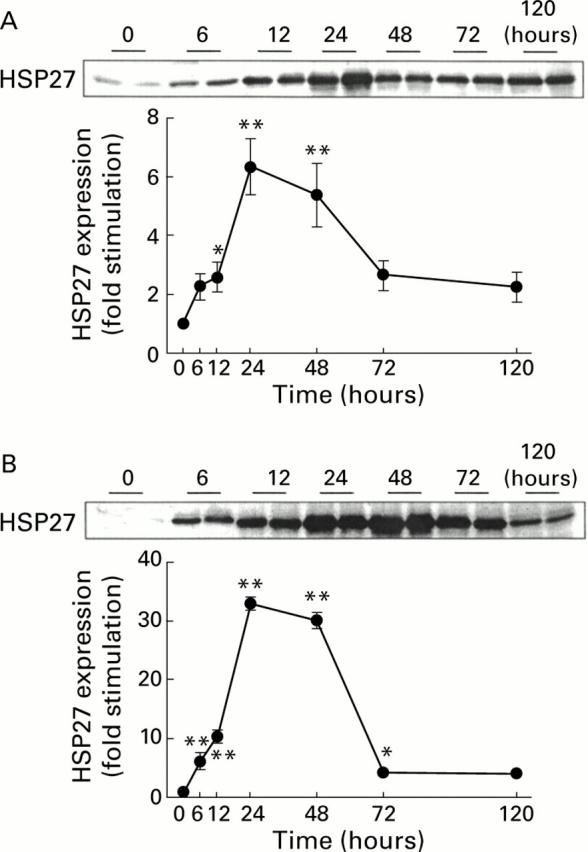
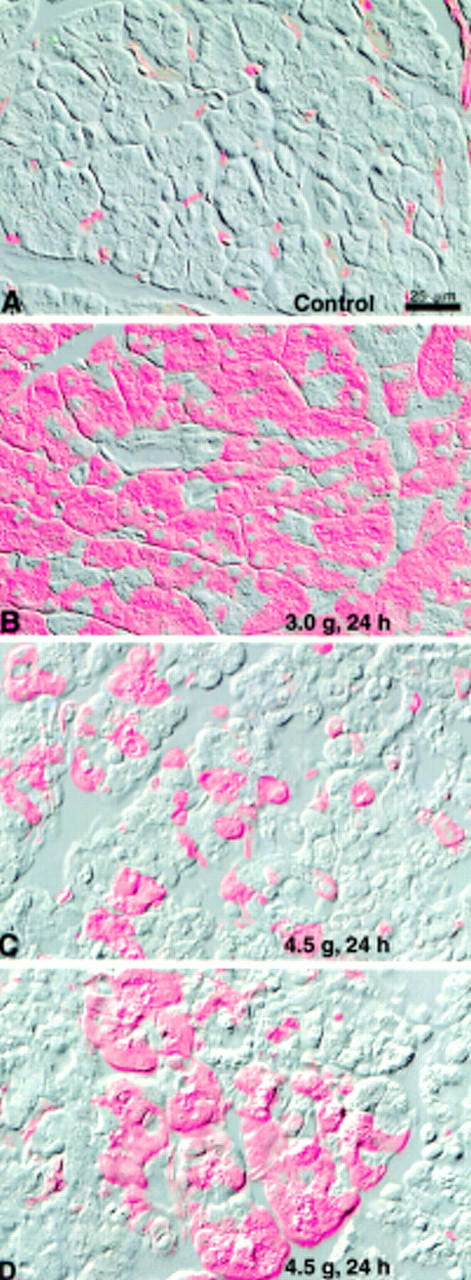
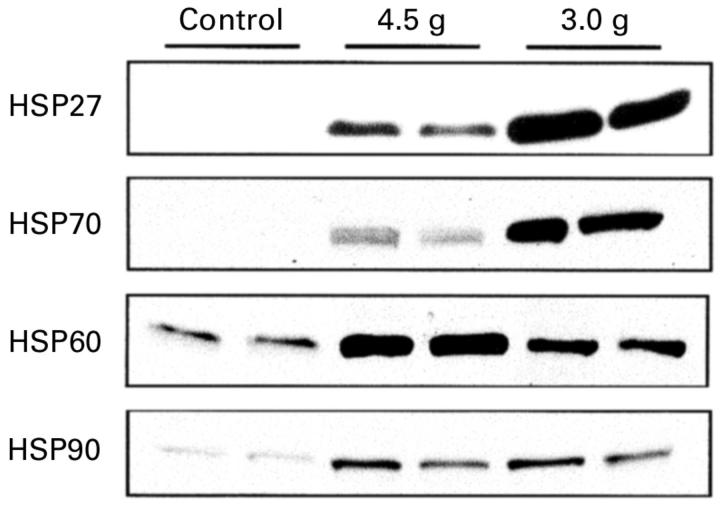
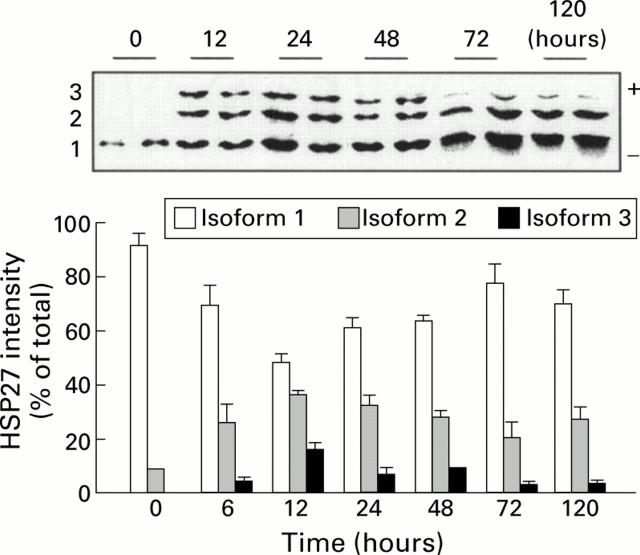
Arginine induced acute pancreatitis was evaluated as a novel and distinct form of experimental pancreatitis with particular attention to the actin cytoskeleton and expression of heat shock or stress proteins. Arginine induced a dose related necrotising pancreatitis in rats, as shown by histological evaluation, and an increase in serum amylase. Severe pancreatitis induced by 4.5 g/kg arginine was accompanied by dramatic changes in the actin cytoskeleton, as visualised with rhodamine phallodin. Intermediate filaments were also disrupted, as visualised by cytokeratin 8/18 immunocytochemistry. Arginine pancreatitis was accompanied by a stress response with a large increase in the small heat shock protein HSP27, as well as HSP70, peaking at 24 hours and localised to acinar cells. There was a lower increase in HSP60 and HSP90 and no effect on GRP78. HSP27 was also shifted to phosphorylated forms during pancreatitis. A lower dose of arginine (3.0 g/kg) induced less pancreatitis but a larger increase in HSP70 and HSP27 expression and phosphorylation of HSP27. Thus HSP expression can be overwhelmed by severe damage. The present work in conjunction with earlier work on caerulein induced pancreatitis indicates that changes in the actin cytoskeleton are an early component in experimental pancreatitis.


Figures

Figure 1
Figure 1
Light micrographs of the pancreas from control and arginine treated rats. Rats were injected with saline (A), 4.5 g/kg arginine (B, C, and D) or with 3.0 g/kg arginine (E and F). After injection with 4.5 g/kg arginine, the pancreas showed interstitial oedema, mild cellular infiltrate, and vacuoles within acinar cells at 12 hours (B), and by 24 hours acinar necrosis involved whole lobules and the acinar architecture was largely disrupted (C). After 72 hours (D), the only remaining acinar remnants were tubular complexes surrounded by fibroblasts and inflammatory cells. Injection of 3.0 g/kg arginine caused less severe pancreatic damage with very mild oedema after 24 hours (E). After 72 hours (F), most of the acinar cells appeared normal but there were small focal areas of fibrosis and inflammation. Haematoxylin and eosin staining.
Figure 2
Figure 2
Time course of serum amylase levels in response to arginine induced acute pancreatitis. Results following administration of 4.5 g/kg arginine (A) or 3.0 g/kg arginine (B). Both show mean (SEM) values from 6-12 animals at each time point. **p<0.01 compared with control (0 hours).
Figure 3
Figure 3
Effects of arginine injection on filamentous actin visualised with phalloidin in pancreatic acinar cells. Rats were injected with either 4.5 or 3.0 g/kg arginine, and pancreata were subsequently processed as described in material and methods. Paired Nomarski images were collected to provide bright field morphological detail. In control pancreatic acini (A, B), actin was present as sharply demarcated bands in the terminal web region just beneath the acinar lumen (large arrows) and subjacent to the lateral and basal plasma membranes. Actin was also present in duct and centroacinar cells (arrowheads). At 12 hours following injection with 4.5 g/kg arginine (C, D), moderate disorganisation/disruption of the normal actin staining pattern was apparent in many acini. Actin was less sharply defined along the basolateral membranes and often appeared discontinuous. Subluminal actin was present as in controls (large arrows) but the staining was often less sharply delineated. Acinar organisation appeared similar to controls (compare B and D). By 24 hours (E, F), the normal pattern of actin distribution was severely disrupted. Readily identifiable sub-luminal actin was no longer apparent, and acinar cells in poorly organised or fragmented acini were often rounded up and these cells generally expressed actin staining continuously along the cell periphery (small arrows in E). Diffuse cytoplasmic fluorescence was also present to varying degrees. Strong actin staining remained in the duct/centroacinar cells (arrowheads). In contrast, at 24 hours after injection with 3.0 g/kg arginine (G, H), acini retained their polarised state, and actin organisation was only moderately pertubed as was the case with the higher dose at 12 hours (compare C and G). Images are representative of at least four individual animals in each group.
Figure 4
Figure 4
Effects of arginine injection on the distribution of amylase, cytokeratin, and actin. Cryostat sections from control animals (A, C) and in animals 24 hours post-injection (4.5 g/kg arginine) (B, D) were double labelled with BODIPY FL labelled phallacidin, and either antiamylase or anticytokeratin 8/18 antisera, followed by Cy3 conjugated second antibody. Immunofluorescence was monitored by confocal microscopy, and digitised images of FITC and Cy3 channels were superimposed. In control tissue (A), amylase (red fluorescence) is present in the secretory granules that fill the apical cytoplasm of acinar cells beneath the actin rich terminal web and lumen (arrows). Actin (green fluorescence) is also associated with basolateral membranes (arrowheads). Cytokeratin distribution (red fluorescence) in control acinar cells (C) is also present within the terminal web (large arrows) where it partially overlaps actin (yellow fluorescence) and along basolateral membranes (arrowheads). A thin band of cytokeratin free actin is present immediately beneath the luminal membrane (green fluorescence). In addition, filamentous cytokeratin strands extend in a rich network from the terminal region towards the basal aspects of the acinar cells (small arrows). Small ducts (asterisk) and their centroacinar cell termini express actin and abundant cytokeratin which overlap in their distribution. After 24 hours, the highly polarised distribution of actin, amylase, and cytokeratin in acinar cells is severely disrupted (B, D). Only a few small clusters of amylase containing secretory granules remain (B), and filamentous cytokeratin is lost, being replaced by a few focal deposits or small aggregates (D). Ducts and centroacinar cells (asterisk) retain actin and cytokeratin staining but in a markedly disorganised form. (A) and (B) are images reconstituted from complete Z series (1 µm steps) using Noran Intervision software. (C) and (D) are single optical sections taken at the focal plane in the Z series where both actin and cytokeratin filaments were defined most sharply.
Figure 5
Figure 5
Time course of heat shock protein 27 (HSP27) expression in response to arginine induced acute pancreatitis. Representative western blots of pancreatic protein lysates from two rats following sodium dodecyl sulphate-polyacrylamide gel electrophoresis (30 µg/lane) are shown for each time point. Results following injection of 4.5 g/kg arginine (A) or 3.0 g/kg arginine (B). Both graphs show mean (SEM) values from 6-12 animals at each time point. In (A), the range of sample fold increases was six hours (0.6-4.6), 12 hours (0.3-5.1), 24 hours (2.5-10.7), 48 hours (1.0-9.0), 72 hours (0.5-6.5), and 120 hours (0.3-3.8). In (B), the range of fold increases was six hours (0.9-17.0), 12 hours (5.1-17.6), 24 hours (28.1-36.0), 48 hours (24.5-32.5), 72 hours (0.9-6.8), and 120 hours (2.0—6.4). *p<0.05; **p<0.01 compared with control (0 hours).
Figure 6
Figure 6
Localisation of heat shock protein 27 (HSP27) in the pancreas of control rats and 24 hours after 3.0 g/kg or 4.5 g/kg arginine injection. Epifluorescence images of HSP27 (coloured red) are overlaid on corresponding Nomarski images. In control rats (A), fluorescent HSP27 staining was limited to small blood vessels. After 3.0 g/kg arginine treatment (B), acinar cells were strongly labelled in a patchy manner. Ducts and blood vessels in the areas strongly expressing HSP27 in acinar cells showed little staining. After 4.5 g/kg arginine treatment (C, D), fewer acinar cells expressed HSP strongly whereas most showed weak or no expression. Acinar structure was compromised at the higher arginine dose, and oedematous areas were present (C). In some areas, foci of well organised acini were sometimes present (D). These acini expressed HSP27 whereas adjacent areas showed little HSP27 staining and poorly organised or disrupted acini. Images are representative of at least three individual animals in each group.
Figure 7
Figure 7
Analysis of heat shock proteins HSP27, HSP70, HSP60, and HSP90 expression at 24 hours after injection of 4.5 g/kg or 3.0 g/kg arginine or saline. Representative western blots of pancreatic protein lysates (30 µg/lane) from two rats following sodium dodecyl sulphate-polyacrylamide gel electrophoresis are shown for each dose of arginine (3.0 and 4.5 g).
Figure 8
Figure 8
Time course of heat shock protein 27 (HSP27) protein phosphorylation in response to 4.5 g/kg arginine induced acute pancreatitis. Representative western blot analysis of pancreatic protein lysates from two rats following isoelectric focusing gel electrophoresis are shown for each time point. Isoform 1, unphosphorylated; isoform 2, monophosphorylated; and isoform 3, diphosphorylated. Both show mean (SEM) values for each isoform as a percentage of the total, obtained from 6-12 animals per time point.

Similar articles

Cited by

References

    1. Exp Cell Res. 2000 Mar 15;255(2):156-70 - PubMed
    1. Am J Physiol. 1997 Oct;273(4 Pt 1):G937-45 - PubMed
    1. Dig Dis Sci. 1997 Jul;42(7):1473-9 - PubMed
    1. Genes Dev. 1999 May 15;13(10):1211-33 - PubMed
    1. Am J Physiol. 1999 Jan;276(1 Pt 1):G219-26 - PubMed

Publication types

MeSH terms