. 2001 Jul 15;534(Pt. 2):313-26.
doi: 10.1111/j.1469-7793.2001.t01-3-00313.x.

Local Ca(2+) transients and distribution of BK channels and ryanodine receptors in smooth muscle cells of guinea-pig vas deferens and urinary bladder

Affiliations

Local Ca(2+) transients and distribution of BK channels and ryanodine receptors in smooth muscle cells of guinea-pig vas deferens and urinary bladder

Y Ohi et al. J Physiol. .

Abstract

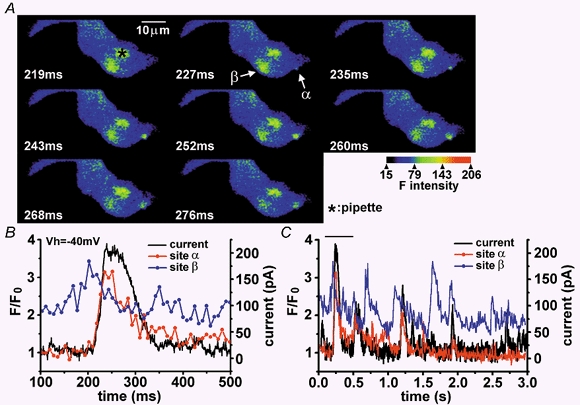
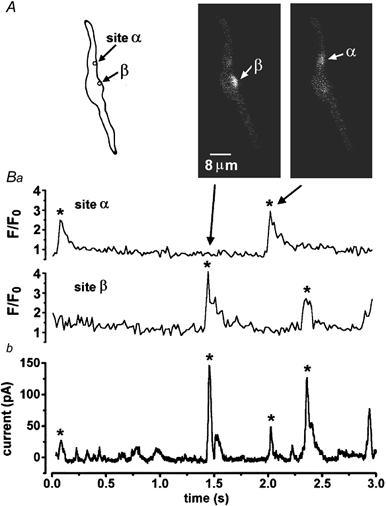
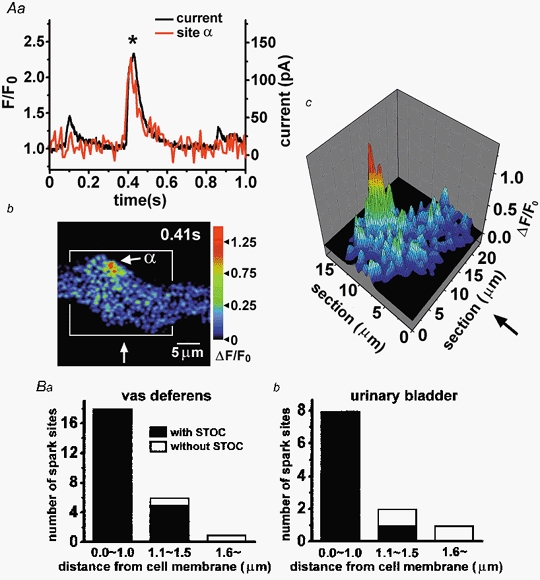
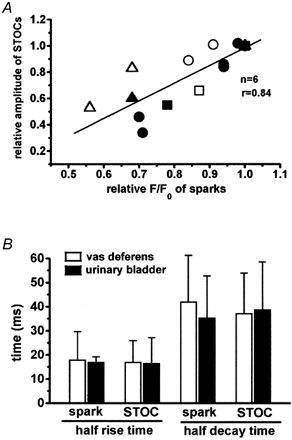
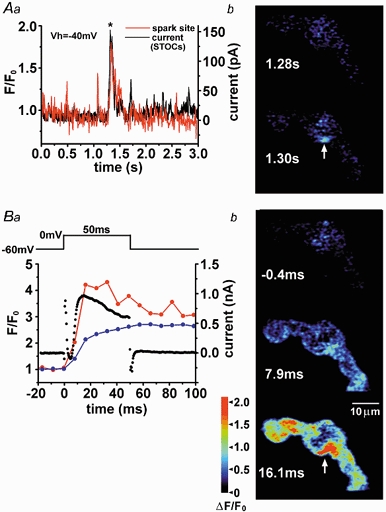
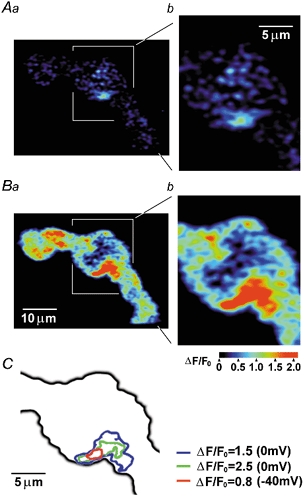
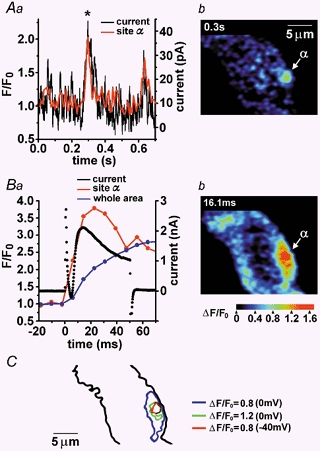
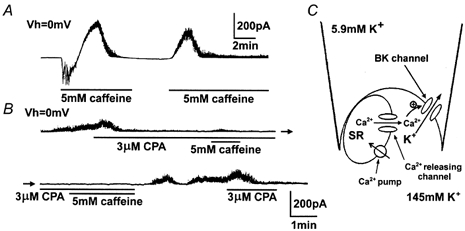
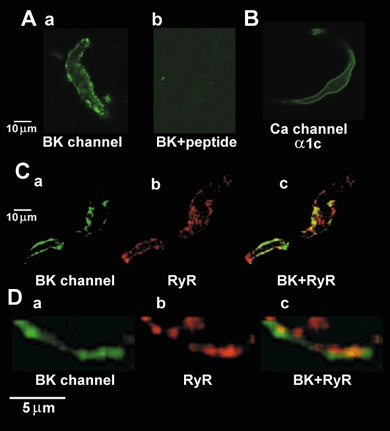
1. The relationship between Ca(2+) sparks spontaneously occurring at rest and local Ca(2+) transients elicited by depolarization was analysed using two-dimensional confocal Ca(2+) images of single smooth muscle cells isolated from guinea-pig vas deferens and urinary bladder. The current activation by these Ca(2+) events was also recorded simultaneously under whole-cell voltage clamp. 2. Spontaneous transient outward currents (STOCs) and Ca(2+) sparks were simultaneously detected at -40 mV in approximately 50 % of myocytes of either type. Ca(2+) sparks and corresponding STOCs occurred repetitively in several discrete sites in the subplasmalemmal area. Large conductance Ca(2+)-dependent K(+) (BK) channel density in the plasmalemma near the Ca(2+) spark sites generating STOCs was calculated to be 21 channels microm(-2). 3. When myocytes were depolarized from -60 to 0 mV, several local Ca(2+) transients were elicited within 20 ms in exactly the same peripheral sites where sparks occurred at rest. The local Ca(2+) transients often lasted over 300 ms and spread into other areas. The appearance of local Ca(2+) transients occurred synchronously with the activation of Ca(2+)-dependent K(+) current (I(K,Ca)). 4. Immunofluorescence staining of the BK channel alpha-subunit (BKalpha) revealed a spot-like pattern on the plasmalemma, in contrast to the uniform staining of voltage-dependent Ca(2+) channel alpha1C subunits along the plasmalemma. Ryanodine receptor (RyR) immunostaining also suggested punctate localization predominantly in the periphery. Double staining of BKalpha and RyRs revealed spot-like co-localization on/beneath the plasmalemma. 5. Using pipettes of relatively low resistance, inside-out patches that included both clustered BK channels at a density of over 20 channels microm(-2) and functional Ca(2+) storage sites were obtained at a low probability of approximately 5%. The averaged BK channel density was 3-4 channels microm(-2) in both types of myocyte. 6. These results support the idea that a limited number of discrete sarcoplasmic reticulum (SR) fragments in the subplasmalemmal area play key roles in the control of BK channel activity in two ways: (i) by generating Ca(2+) sparks at rest to activate STOCs and (ii) by generating Ca(2+) transients presumably triggered by sparks during an action potential to activate a large I(K,Ca) and also induce a contraction. BK channels and RyRs may co-localize densely at the junctional areas of plasmalemma and SR fragments, where Ca(2+) sparks occur to elicit STOCs.


Figures

Figure 1
Figure 1. Simultaneous measurement of confocal Ca2+ images and membrane currents in a urinary bladder myocyte
A, Ca2+ images were obtained using confocal microscopy and fluo-3 from a urinary bladder myocyte that was voltage clamped at −40 mV. Images were obtained every 8.25 ms during the continuous recording for 3 s and are shown sequentially. The asterisk indicates the point where the recording pipette was attached. Ca2+ sparks were observed at two distinct sites, α and β. The calibration of fluorescence (F) intensity is indicated by the colour scale bar. B, the time course of F/F0 (F0, basal F in whole cell area) and membrane current measured simultaneously from 100 to 500 ms during the recording for 3 s (indicated by the horizontal bar in C). Red and blue lines indicate relative fluorescence intensity (F/F0) measured at the Ca2+ spark sites α and β, respectively. Fluorescence intensity was measured as the average at pixels in a circular spot of 1.3 μm in diameter, which was located in the centre of the spark site. The black line indicates the membrane current. Note that the activation of the Ca2+ spark in site α was synchronized with that of a spontaneous transient outward current (STOC). C, the time course of relative fluorescence intensity (F/F0) and membrane current during the recording for 3 s. Eight STOCs (> 50 pA) were recorded and four of them occurred synchronously with Ca2+ sparks at site α in one to one manner. At least six Ca2+ sparks were observed at site β during the recording period but none of them was synchronized with STOC (> 50 pA).
Figure 2
Figure 2. STOCs were elicited by Ca2+ sparks in small number of discrete sites in the subplasmalemmal area
A, a schematic cell image (left) and two confocal Ca2+ images (middle and right) from a vas deferens myocyte in which two Ca2+ spark sites are indicated as α and β. Ca2+ images were obtained every 16.5 ms with a large confocal aperture. B, the relative fluorescence intensity at sites α and β is plotted as F/F0 against the recording time (3 s) in a. The two Ca2+ images shown in A were obtained at the times indicated by the arrows. Simultaneously recorded membrane currents are plotted in b. Note that the four major STOCs in b occurred synchronously with Ca2+ sparks at the two sites, as indicated by asterisks.
Figure 3
Figure 3. Location of Ca2+ sparks in myocytes
A, a Ca2+ spark and concomitant STOC were recorded in a vas deferens myocyte at a holding potential of −40 mV. The time course of F/F0 (red line) at the Ca2+ spark site (α) and that of membrane currents simultaneously measured (black line) are shown in a. The Ca2+ spark image obtained at the peak F/F0 in a (asterisk) is shown in b. The Ca2+ image was adjusted by subtracting the averaged basal image. The Ca2+ image in the boxed area in b is shown as a three-dimensional surface plot of the change in F/F0F/F0) in c. The view direction indicated by the arrow in c corresponds to that in b. B, a distribution histogram of the distance between Ca2+ sparks and the plasmalemma obtained for 25 Ca2+ sparks from 12 vas deferens myocytes (a) and 11 sparks from five urinary bladder myocytes (b). The number of Ca2+ sparks is shown against the distance between the centre of the sparks and the closest part of the plasmalemma. The filled and open columns indicate Ca2+ sparks that occurred in synchrony with STOCs and those that did not, respectively. Note that all Ca2+ sparks occurring in the subplasmalemmal area (< 1 μm) were synchronous with STOCs, while sparks without STOCs occurred in non-peripheral areas.
Figure 4
Figure 4. Kinetic parameters of Ca2+ sparks and corresponding STOCs
A, the relationship between the relative fluorescence intensity (F/F0) of Ca2+ sparks and the relative amplitude of STOCs occurring synchronously as 14 pairs in six separate myocytes of vas deferens. Different symbols indicate the data obtained from six different cells. F/F0 was measured and the largest F/F0 value was taken as 1.0 in each myocyte. The relative amplitude of STOCs was obtained by taking the largest as 1.0 in each cell. There was a significant correlation between these two parameters (r = 0.84, P < 0.05 by χ2 test). B, the half-rise time and half-decay times of F/F0 of Ca2+ sparks and of STOCs, which occurred synchronously in one to one manner at a holding potential of −40 mV. The time required for the rise of F/F0 and STOCs from the baseline to the half-peak amplitude and that for the decay were measured as the half-rise and -decay time, respectively. In each myocyte, two or three pairs of Ca2+ sparks and STOCs were selected and the averaged values of half-rise and -decay time were obtained. Open and filled columns indicate the mean values in myocytes from vas deferens (n = 12) and urinary bladder (n = 5), respectively. There was no significant difference between the half-rise time of Ca2+ sparks and that of STOCs or between the half-decay time of Ca2+ sparks and that of STOCs in both types of myocytes.
Figure 5
Figure 5. The spatial relationship between Ca2+ sparks at rest and early Ca2+ transients upon depolarization in a vas deferens myocyte (I)
A, the time course of membrane current (black line) and that of F/F0 (red line) at a Ca2+ spark site, at a holding potential (Vh) of −40 mV, are shown in a. F/F0 was measured at the Ca2+ spark site indicated by an arrow in b. Ca2+ images, which were obtained at rest (1.28 s) and at the peak of the STOC (1.30 s) in the time course in a are shown in b. The images were adjusted by subtraction of the averaged basal image. B, the membrane current (IK,Ca, black dots), F/F0 at the same site as the Ca2+ spark in A (red circles) and F/F0 in the whole cell area (blue circles) are plotted against time in a. The same myocyte as shown in A was depolarized from −60 to 0 mV for 50 ms. The Ca2+ images shown in b were obtained at the corresponding time in a and adjusted by subtracting the averaged basal image. The arrow in b indicates the spark site in A.
Figure 6
Figure 6. The spatial relationship between Ca2+ sparks at rest and early Ca2+ transients upon depolarization in a vas deferens myocyte (II)
The location of early Ca2+ transients upon depolarization was exactly compared with that of the Ca2+ spark site. The Ca2+ spark image in Aa and the Ca2+ transient image in Ba are the same as those shown in Fig. 5Ab and Bb, respectively. The boxed area in a is shown at higher magnification in b. C, a contour map of ΔF/F0 for the area shown in Ab and Bb. The area enclosed by the red line indicates the Ca2+ spark site (ΔF/F0 > 0.8) at −40 mV. The areas enclosed by green and blue lines indicate the centre (ΔF/F0 > 2.5) and the surrounding area (ΔF/F0 > 1.5) of the early Ca2+ transient during depolarization to 0 mV. Note that the Ca2+ spark site is completely included in the centre of the early Ca2+ transient upon depolarization.
Figure 7
Figure 7. The relationship between Ca2+ sparks and Ca2+ transients in urinary bladder myocytes
A, a STOC and corresponding Ca2+ spark were measured in urinary bladder myocytes in the same manner as in Fig. 5. F/F0 at the spark site (spot α) and membrane current at −40 mV are plotted against time (red and black lines, respectively) in a. The Ca2+ spark image in b was obtained at the peak F/F0 as indicated by the asterisk in a. B, the early Ca2+ transient during depolarization from −60 to 0 mV and corresponding membrane currents were measured in the same myocyte as in A. F/F0 at spot α, F/F0 in the whole-cell image and membrane current are plotted against time in a. The Ca2+ image at 16.1 ms is shown in b. C, a contour map of ΔF/F0 in the same area as shown in Ab and Bb. The area enclosed by the red line indicates the Ca2+ spark site (ΔF/F0 > 0.8) at −40 mV. The areas enclosed by green and blue lines indicate the centre (ΔF/F0 > 1.2) and the surrounding area (ΔF/F0 > 0.8) of the early Ca2+ transient during depolarization to 0 mV. Note that the Ca2+ spark site is completely included in the centre of the early Ca2+ transient upon depolarization.
Figure 8
Figure 8. BK channel activity in inside-out patches with functional SR
Single channel currents of BK channels were recorded in an inside-out patch isolated from a vas deferens myocyte. The pipette resistance was approximately 4 MΩ. The holding potential was 0 mV. A, the activity of ion channels induced by application of 5 mm caffeine. An inward current was observed only upon the first application of caffeine. Large outward currents were recorded when 5 mm caffeine was applied again 3 min after the first application. B, the opening of BK channels was observed under control conditions. Application of 3 μm CPA transiently enhanced the activities of BK channels and then suppressed them. Further addition of caffeine resulted in only a small transient activation of BK channels. After washout of CPA, the spontaneous activity of BK channels recovered and then the effect of CPA was observed again. C, schematic diagram of the inside-out patch with functional SR fragment shown in A and B. The K+ concentration in the pipette and the bathing solutions was 5.9 and 145 mm, respectively. The bathing solution contained 100 μm EGTA and 2 mm ATP. The inside-out configuration was confirmed by the exchange of the bathing solution with one of pCa 4.5, which resulted in the immediate activation of a huge BK channel current (∼400 pA, not shown).
Figure 9
Figure 9. Immunostaining of BK channels, Ca2+ channels and RyRs in vas deferens myocytes
A, confocal image of BK channel α subunit (BKα) distribution in a myocyte. Anti-BKα antibody was detected with FITC fluorescence (a). A spot-like distribution on the plasmalemma was observed. When an excess amount of antigen peptide was added and the myocyte was treated with anti-BKα antibody, no fluorescence was observed (b). B, immunostaining of a myocyte with anti-Ca2+ channel α1C subunit antibody, which shows peripheral and uniform fluorescence along the plasmalemma. Ca, spot-like distribution of BKα as in Aa. Cb, immunostaining of RyRs (Alexa Fluor 568) in the same myocyte as shown in a. The double-stained images in a and b are shown superimposed in c. The punctate staining of co-localized BKα and RyRs is shown as yellow spots. D, images from double immunostaining of BKα(b) and RyRs (b), and the two images superimposed (c) shown at higher magnification. The images were obtained from a different myocyte from that in C. Note the punctate co-localization of BKα and RyRs indicated by yellow dots.

Similar articles

Cited by

References

    1. Arnaudeau S, Boittin FX, Macrez N, Lavie JL, Mironneau C, Mironneau J. L-type and Ca2+ release channel-dependent hierarchical Ca2+ signalling in rat portal vein myocytes. Cell Calcium. 1997;22:399–411. - PubMed
    1. Benham CD, Bolton TB. Spontaneous transient outward currents in single visceral and vascular smooth muscle cells of the rabbit. Journal of Physiology. 1986;381:385–406. - PMC - PubMed
    1. Berridge MJ. Elementary and global aspects of calcium signalling. Journal of Physiology. 1997;499:291–306. - PMC - PubMed
    1. Bolton TB, Imaizumi Y. Spontaneous transient outward currents in smooth muscle cells. Cell Calcium. 1996;20:141–152. - PubMed
    1. Bolton TB, Prestwich SA, Zholos AV, Gordienko DV. Excitation-contraction coupling in gastrointestinal and other smooth muscles. Annual Review of Physiology. 1999;61:85–115. - PubMed

Publication types

MeSH terms

Substances

LinkOut - more resources