

Calcium currents and transients in co-cultured contracting normal and Duchenne muscular dystrophy human myotubes
- PMID: 11454955
- PMCID: PMC2278716
- DOI: 10.1111/j.1469-7793.2001.00343.x
Calcium currents and transients in co-cultured contracting normal and Duchenne muscular dystrophy human myotubes
Abstract
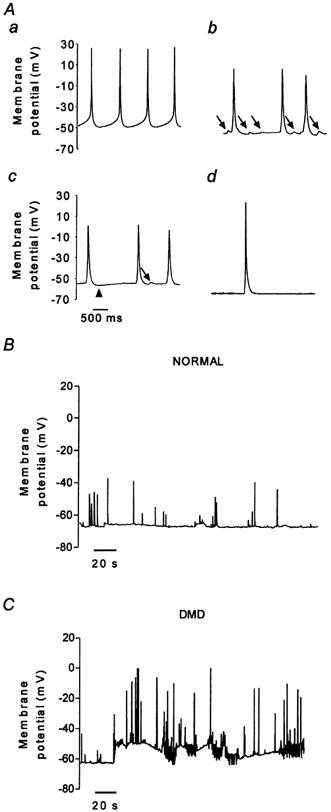
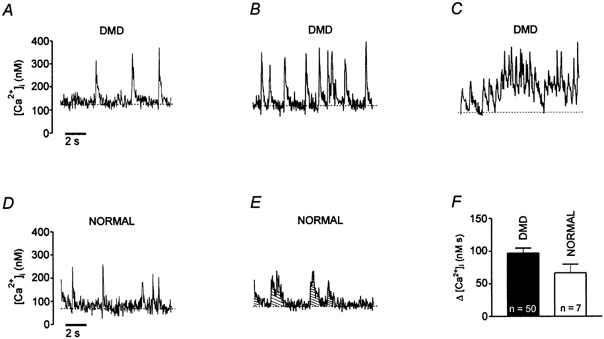
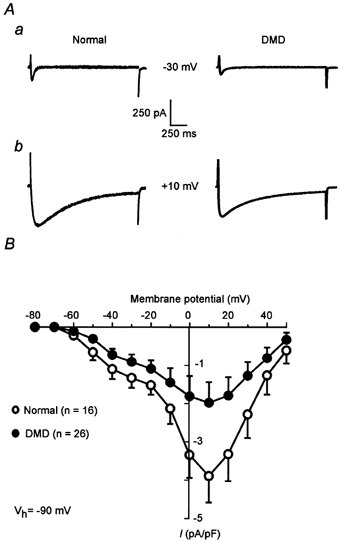
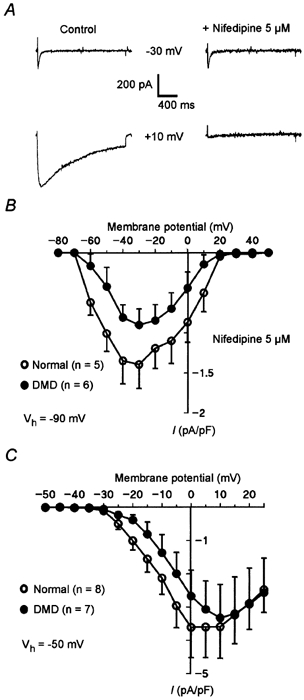
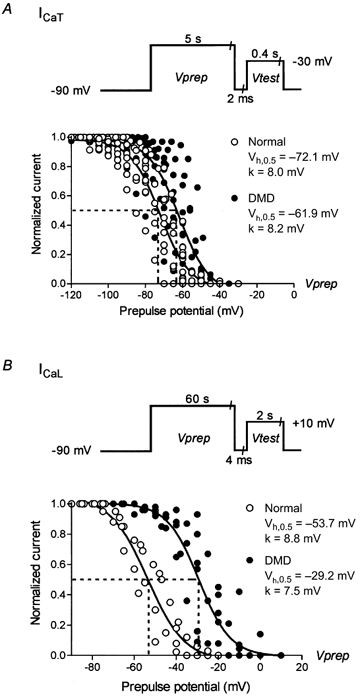
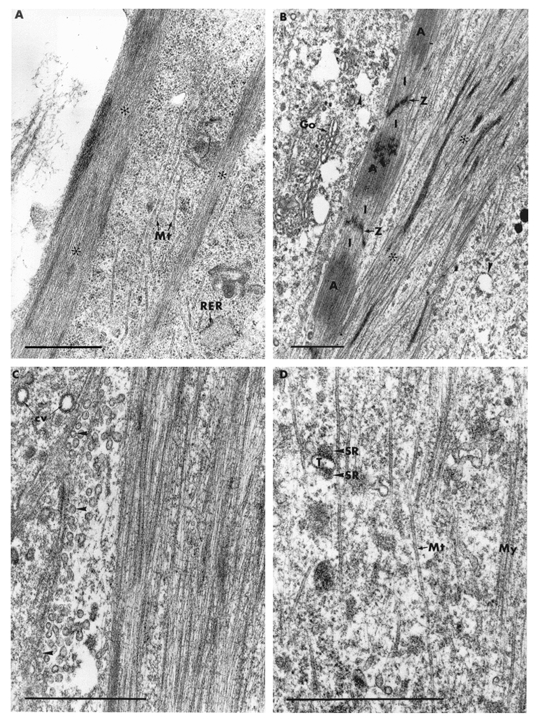
1. The goal of the present study was to investigate differences in calcium movements between normal and Duchenne muscular dystrophy (DMD) human contracting myotubes co-cultured with explants of rat spinal cord with attached dorsal root ganglia. Membrane potential, variations of intracellular calcium concentration and T- and L-type calcium currents were recorded. Further, a descriptive and quantitative study by electron microscopy of the ultrastructure of the co-cultures was carried out. 2. The resting membrane potential was slightly less negative in DMD (-61.4 +/- 1.1 mV) than in normal myotubes (-65.5 +/- 0.9 mV). Both types of myotube displayed spontaneous action potentials (mean firing frequency, 0.42 and 0.16 Hz, respectively), which triggered spontaneous calcium transients measured with Indo-1. 3. The time integral under the spontaneous Ca(2+) transients was significantly greater in DMD myotubes (97 +/- 8 nM s) than in normal myotubes (67 +/- 13 nM s). 4. The L- and T-type current densities estimated from patch-clamp recordings were smaller in DMD cells (2.0 +/- 0.5 and 0.90 +/- 0.19 pA pF(-1), respectively) than in normal cells (3.9 +/- 0.7 and 1.39 +/- 0.30 pA pF(-1), respectively). 5. The voltage-dependent inactivation relationships revealed a shift in the conditioning potential at which inactivation is half-maximal (V(h,0.5)) of the T- and L-type currents towards less negative potentials, from -72.1 +/- 0.7 and -53.7 +/- 1.5 mV in normal cells to -61.9 +/- 1.4 and -29.2 +/- 1.4 mV in DMD cells, respectively. 6. Both descriptive and quantitative studies by electron microscopy suggested a more advanced development of DMD myotubes as compared to normal ones. This conclusion was supported by the significantly larger capacitance of the DMD myotubes (408 +/- 45 pF) than of the normal myotubes (299 +/- 34 pF) of the same apparent size. 7. Taken together, these results show that differences in T- and L-type calcium currents between normal and DMD myotubes cannot simply explain all observed alterations in calcium homeostasis in DMD myotubes, thus suggesting that other transmembrane calcium transport mechanisms must also be altered in DMD myotubes compared with normal myotubes.
Figures
Similar articles
-
New insights in the regulation of calcium transfers by muscle dystrophin-based cytoskeleton: implications in DMD.J Muscle Res Cell Motil. 2006;27(5-7):375-86. doi: 10.1007/s10974-006-9085-2. Epub 2006 Aug 4. J Muscle Res Cell Motil. 2006. PMID: 16897576 Review.
-
Abnormal calcium homeostasis in Duchenne muscular dystrophy myotubes contracting in vitro.Cell Calcium. 1995 Sep;18(3):177-86. doi: 10.1016/0143-4160(95)90062-4. Cell Calcium. 1995. PMID: 8529258
-
Normal calcium homeostasis in dystrophin-expressing facioscapulohumeral muscular dystrophy myotubes.Neuromuscul Disord. 2002 Mar;12(3):266-72. doi: 10.1016/s0960-8966(01)00279-6. Neuromuscul Disord. 2002. PMID: 11801398
-
Involvement of TRPV2 and SOCE in calcium influx disorder in DMD primary human myotubes with a specific contribution of α1-syntrophin and PLC/PKC in SOCE regulation.Am J Physiol Cell Physiol. 2013 May 1;304(9):C881-94. doi: 10.1152/ajpcell.00182.2012. Epub 2013 Feb 20. Am J Physiol Cell Physiol. 2013. PMID: 23426965
-
How calcium influx through calcium leak channels is responsible for the elevated levels of calcium-dependent proteolysis in dystrophic myotubes.Trends Cardiovasc Med. 2000 Aug;10(6):268-72. doi: 10.1016/s1050-1738(00)00075-x. Trends Cardiovasc Med. 2000. PMID: 11282306 Review.
Cited by
-
Functional classification of skeletal muscle networks. II. Applications to pathophysiology.J Appl Physiol (1985). 2012 Dec 15;113(12):1902-20. doi: 10.1152/japplphysiol.01515.2011. Epub 2012 Oct 18. J Appl Physiol (1985). 2012. PMID: 23085957 Free PMC article.
-
Nifedipine treatment reduces resting calcium concentration, oxidative and apoptotic gene expression, and improves muscle function in dystrophic mdx mice.PLoS One. 2013 Dec 9;8(12):e81222. doi: 10.1371/journal.pone.0081222. eCollection 2013. PLoS One. 2013. PMID: 24349043 Free PMC article.
-
New insights in the regulation of calcium transfers by muscle dystrophin-based cytoskeleton: implications in DMD.J Muscle Res Cell Motil. 2006;27(5-7):375-86. doi: 10.1007/s10974-006-9085-2. Epub 2006 Aug 4. J Muscle Res Cell Motil. 2006. PMID: 16897576 Review.
-
Mini-dystrophin expression down-regulates overactivation of G protein-mediated IP3 signaling pathway in dystrophin-deficient muscle cells.J Gen Physiol. 2006 Feb;127(2):171-82. doi: 10.1085/jgp.200509456. J Gen Physiol. 2006. PMID: 16446505 Free PMC article.
-
Low-voltage-activated ("T-Type") calcium channels in review.J Bioenerg Biomembr. 2003 Dec;35(6):533-75. doi: 10.1023/b:jobb.0000008024.77488.48. J Bioenerg Biomembr. 2003. PMID: 15000520 Review.
References
-
- Bodensteiner JB, Engel AG. Intracellular calcium accumulation in Duchenne dystrophy and other myopathies: a study of 567,000 muscle fibres in 114 biopsies. Neurology. 1978;28:439–446. - PubMed
-
- Bonilla E, Samitt CE, Miranda AF, Hays AP, Salviati G, Dimauro S, Kunkel LM, Hoffman EP, Rowland LP. Duchenne muscular dystrophy: deficiency of dystrophin at the muscle surface. Cell. 1988;54:447–452. - PubMed
-
- Cognard C, Constantin B, Rivet-Bastide M, Imbert N, Besse C, Raymond G. Appearance and evolution of calcium currents and contraction during the early post-fusional stages of rat skeletal muscle cells developing in primary culture. Development. 1993;117:1153–1161. - PubMed
-
- Delaporte C, Dautreaux B, Fardeau M. Human myotube differenciation in vitro in different culture conditions. Biology of the Cell. 1986;57:17–22. - PubMed
MeSH terms
Substances
LinkOut - more resources
Full Text Sources
Research Materials
Miscellaneous