

Regulation of a G protein-gated inwardly rectifying K+ channel by a Ca(2+)-independent protein kinase C
- PMID: 11454957
- PMCID: PMC2278717
- DOI: 10.1111/j.1469-7793.2001.00367.x
Regulation of a G protein-gated inwardly rectifying K+ channel by a Ca(2+)-independent protein kinase C
Abstract
1. Members of the Kir3.0 family of inwardly rectifying K(+) channels are expressed in neuronal, atrial and endocrine tissues and play key roles in generating late inhibitory postsynaptic potentials (IPSPs), slowing heart rate and modulating hormone release. They are activated directly by G(betagamma) subunits released in response to G(i/o)-coupled receptor stimulation. However, it is not clear to what extent this process can be dynamically regulated by other cellular signalling systems. In this study we have explored pathways activated by the G(q/11)-coupled M(1) and M(3) muscarinic receptors and their role in the regulation of Kir3.1+3.2A neuronal-type channels stably expressed in the human embryonic kidney cell line HEK293. 2. We describe a novel biphasic pattern of behaviour in which currents are initially stimulated but subsequently profoundly inhibited through activation of M(1) and M(3) receptors. This contrasts with the simple stimulation seen through activation of M(2) and M(4) receptors. 3. Channel stimulation via M(1) but not M(3) receptors was sensitive to pertussis toxin whereas channel inhibition through both M(1) and M(3) receptors was insensitive. In contrast over-expression of the C-terminus of phospholipase Cbeta1 or a G(q/11)-specific regulator of G protein signalling (RGS2) essentially abolished the inhibitory phase. 4. The inhibitory effects of M(1) and M(3) receptor stimulation were mimicked by phorbol esters and a synthetic analogue of diacylglycerol but not by the inactive phorbol ester 4alphaphorbol. Inhibition of the current by a synthetic analogue of diacylglycerol effectively occluded any further inhibition (but not activation) via the M(3) receptor. 5. The receptor-mediated inhibitory phenomena occur with essentially equal magnitude at all intracellular calcium concentrations examined (range, 0-669 nM). 6. The expression of endogenous protein kinase C (PKC) isoforms in HEK293 cells was examined by immunoblotting, and their translocation in response to phorbol ester treatment by cellular extraction. The results indicated the expression and translocation of the novel PKC isoforms PKCdelta and PKCepsilon. 7. We also demonstrate that activation of such a pathway via both receptor-mediated and receptor-independent means profoundly attenuated subsequent channel stimulation by G(i/o)-coupled receptors. 8. Our data support a role for a Ca(2+)-independent PKC isoform in dynamic channel regulation, such that channel activity can be profoundly reduced by M(1) and M(3) muscarinic receptor stimulation.
Figures


 , current density after agonist is removed (Wash). Numbers in parentheses indicate the number of cells recorded from. In control cells M2 stimulation increased basal current density from 61.4 ± 8.4 to 214.9 ± 31.3 pA pF−1(n = 16, **P < 0.01) whilst M4 receptor stimulation increased current density from 82.9 ± 19.2 to 251.9 ± 47.6 pA pF−1(n = 15, **P < 0.01). In PTx-treated cells (100 ng ml−1, 16 h) carbachol was unable to potentiate Kir3.1+3.2A currents (M2: basal 83.8 ± 15.1 pA pF−1, +carbachol 95.0 ± 12.1 pA pF−1, n = 6, P = 0.12; M4: basal 53.3 ± 11.7 pA pF−1, +carbachol 56.6 ± 13.8 pA pF−1, n = 8, P = 0.44).
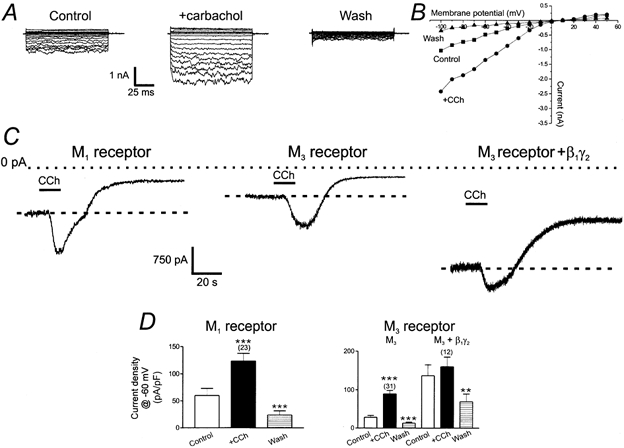

 , current density measured at the end of the drug application (+CCh end);
  , current density after the removal of stimulus (Wash). Levels of significance are shown with respect to Control current density. *P < 0.05; **P < 0.01; ***P < 0.001.

 ), but is ineffective on both channel activation and inhibition due to M3 receptor stimulation. D, the C-terminus of PLCβ1 (PLCβ1ct) attenuated M3-mediated inhibition (M3+PLCβ1ct: basal 13.9 ± 3.2 pA pF−1, +carbachol 55.7 ± 15.3 pA pF−1, wash 11.6 ± 4.2 pA pF−1(n = 9)). Thus M3-mediated percentage inhibition was reduced from 78.7 ± 2.7 %(n = 16) in the absence of PLCβ1ct to 23.5 ± 10.6 %(n = 9, P < 0.001) in its presence. These experiments were performed in the HKIR3.1/3.2/M3 stable cell line. E, bar chart summarizing the effects of co-expression of RGS2 upon M1 and M3 responses (M1+RGS2: basal 22.3 ± 3.8 pA pF−1, +carbachol 74.0 ± 21.3 pA pF−1, wash 15.0 ± 2.5 pA pF−1(n = 5); M3+RGS2: basal 47.7 ± 10.0 pA pF−1, +carbachol 110.3 ± 36.3 pA pF−1, wash 38.9 ± 10.0 pA pF−1(n = 8)). RGS2 reduced M1-mediated percentage inhibition from 62.1 ± 4.8 %(n = 23) to 29.6 ± 8.7 %(n = 5, P < 0.01) and M3-mediated percentage inhibition from 47.6 ± 4.4 %(n = 31) to 20.0 ± 11.7 %(n = 8, P = 0.01). *P < 0.05; **P < 0.01.


Similar articles
-
Gating properties of GIRK channels activated by Galpha(o)- and Galpha(i)-coupled muscarinic m2 receptors in Xenopus oocytes: the role of receptor precoupling in RGS modulation.J Physiol. 2002 Dec 1;545(2):355-73. doi: 10.1113/jphysiol.2002.032151. J Physiol. 2002. PMID: 12456817 Free PMC article.
-
PKC-delta sensitizes Kir3.1/3.2 channels to changes in membrane phospholipid levels after M3 receptor activation in HEK-293 cells.Am J Physiol Cell Physiol. 2005 Sep;289(3):C543-56. doi: 10.1152/ajpcell.00025.2005. Epub 2005 Apr 27. Am J Physiol Cell Physiol. 2005. PMID: 15857907
-
The role of members of the pertussis toxin-sensitive family of G proteins in coupling receptors to the activation of the G protein-gated inwardly rectifying potassium channel.Proc Natl Acad Sci U S A. 2000 May 9;97(10):5651-6. doi: 10.1073/pnas.080572297. Proc Natl Acad Sci U S A. 2000. PMID: 10779550 Free PMC article.
-
Molecular mechanisms mediating inhibition of G protein-coupled inwardly-rectifying K+ channels.Mol Cells. 2003 Feb 28;15(1):1-9. Mol Cells. 2003. PMID: 12661754 Review.
-
Modulation of ion channels by somatostatin and acetylcholine.Prog Neurobiol. 1992;38(2):203-30. doi: 10.1016/0301-0082(92)90040-l. Prog Neurobiol. 1992. PMID: 1372125 Review.
Cited by
-
Decrease in PIP(2) channel interactions is the final common mechanism involved in PKC- and arachidonic acid-mediated inhibitions of GABA(B)-activated K+ current.J Physiol. 2007 Aug 1;582(Pt 3):1037-46. doi: 10.1113/jphysiol.2007.137265. Epub 2007 Jun 21. J Physiol. 2007. PMID: 17584838 Free PMC article.
-
Receptor-specific inhibition of GABAB-activated K+ currents by muscarinic and metabotropic glutamate receptors in immature rat hippocampus.J Physiol. 2007 Apr 15;580(Pt. 2):411-22. doi: 10.1113/jphysiol.2006.125914. Epub 2007 Jan 25. J Physiol. 2007. PMID: 17255165 Free PMC article.
-
Signal transduction pathway for the substance P-induced inhibition of rat Kir3 (GIRK) channel.J Physiol. 2005 Apr 15;564(Pt 2):489-500. doi: 10.1113/jphysiol.2004.079285. Epub 2005 Feb 24. J Physiol. 2005. PMID: 15731196 Free PMC article.
-
Two different inward rectifier K+ channels are effectors for transmitter-induced slow excitation in brain neurons.Proc Natl Acad Sci U S A. 2002 Oct 29;99(22):14494-9. doi: 10.1073/pnas.222379999. Epub 2002 Oct 21. Proc Natl Acad Sci U S A. 2002. PMID: 12391298 Free PMC article.
-
Gi/o-coupled muscarinic receptors co-localize with GIRK channel for efficient channel activation.PLoS One. 2018 Sep 21;13(9):e0204447. doi: 10.1371/journal.pone.0204447. eCollection 2018. PLoS One. 2018. PMID: 30240440 Free PMC article.
References
-
- Baukrowitz T, Schulte U, Oliver D, Herlitze S, Krauter T, Tucker SJ, Ruppersberg JP, Fakler B. PIP2 and PIP as determinants for ATP inhibition of KATP channels. Science. 1998;282:1141–1144. - PubMed
-
- Berstein G, Blank JL, Jhon D-Y, Exton JH, Rhee SG, Ross EM. Phospholipase C-β1 is a GTPase-activating protein for Gq/11, its physiological regulator. Cell. 1992;70:411–418. - PubMed
-
- Braun AP, Fedida D, Giles WR. Activation of α1-adrenoceptors modulates the inwardly rectifying potassium currents of mammalian atrial myocytes. Pflügers Archiv. 1992;421:431–439. - PubMed
-
- Breitwieser GE, Szabo G. Uncoupling of cardiac muscarinic and β-adrenergic receptors from ion channels by a guanine nucleotide analogue. Nature. 1985;317:538–540. - PubMed
-
- Brown DA, Adams PR. Muscarinic suppression of a novel voltage-sensitive K+ current in a vertebrate neurone. Nature. 1980;283:673–676. - PubMed
Publication types
MeSH terms
Substances
LinkOut - more resources
Full Text Sources
Miscellaneous