

The dynamic characteristics of the feedback signal from horizontal cells to cones in the goldfish retina
- PMID: 11454966
- PMCID: PMC2278715
- DOI: 10.1111/j.1469-7793.2001.t01-1-00489.x
The dynamic characteristics of the feedback signal from horizontal cells to cones in the goldfish retina
Abstract
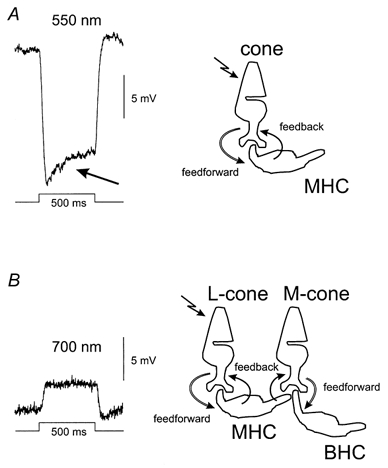
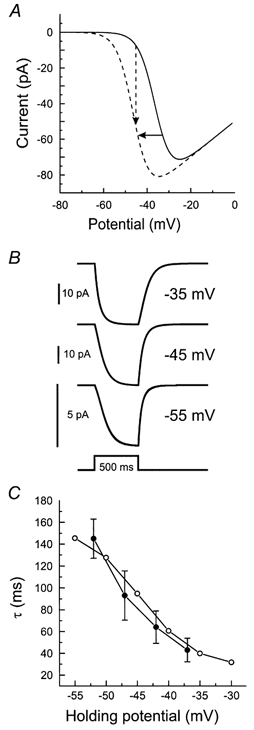
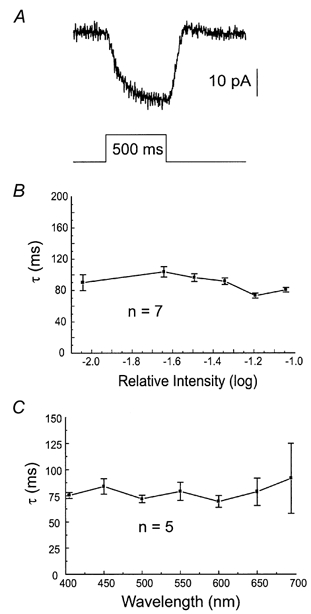
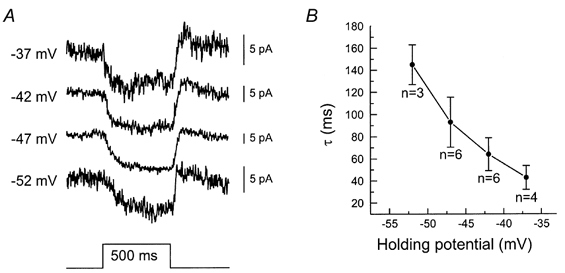
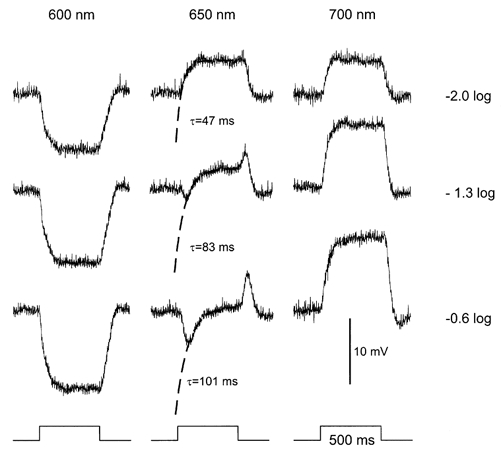
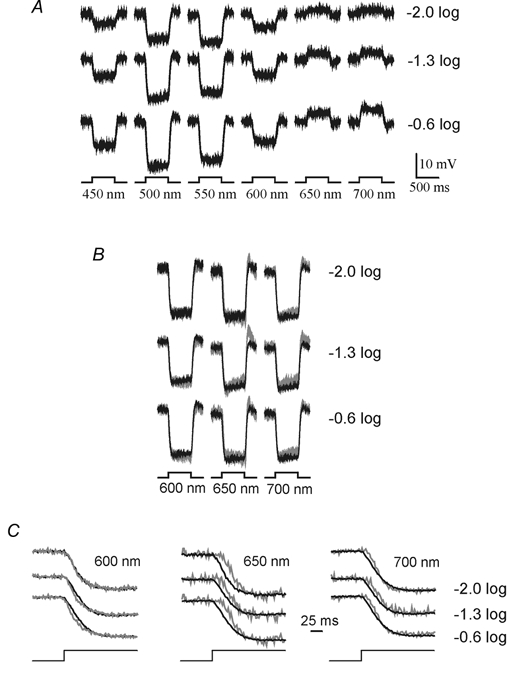
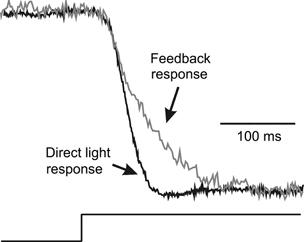
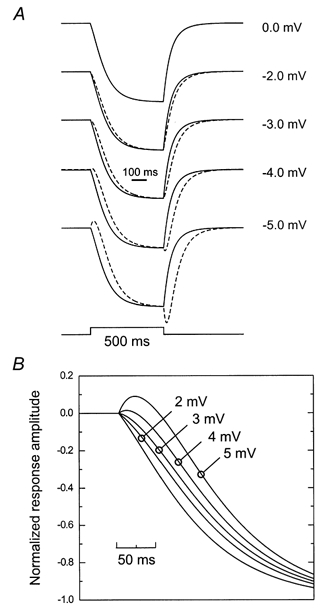
1. The dynamic properties of the microcircuitry formed by cones and horizontal cells in the isolated goldfish retina were studied. Cones project to horizontal cells and horizontal cells feed back to cones via a relatively slow negative feedback pathway. 2. The time constant of the feedback signal in cones and of the effect this feedback signal had on the responses of second-order neurons was determined using whole-cell patch clamp and intracellular recording techniques. 3. It was found that the feedback signal in cones had a time constant of around 80 ms, whereas the time constant of the effect this feedback signal had on the second-order neurons ranged from 36 to 116 ms. This range of time constants can be accounted for by the non-linearity of the Ca(2+) current in the cones. In depolarized cones, the feedback-mediated response in second-order neurons had a similar time constant to that of the direct light response of the cone, whereas in hyperpolarized cones, the time constant of the feedback-mediated response in second-order neurons was considerably larger. 4. Further, it was shown that there was no delay in the feedback pathway. This is in contrast to what has been deduced from the response properties of second-order neurons. In one type of horizontal cell, the responses to red light were delayed relative to the responses to green light. This delay in the second-order neurons can be accounted for by the interaction of the direct light response of the medium-wavelength-sensitive cones (M-cones) with the feedback response of the M-cones received from the horizontal cells.
Figures
Similar articles
-
The open- and closed-loop gain-characteristics of the cone/horizontal cell synapse in goldfish retina.J Neurophysiol. 2000 Sep;84(3):1256-65. doi: 10.1152/jn.2000.84.3.1256. J Neurophysiol. 2000. PMID: 10980000
-
The nature of surround-induced depolarizing responses in goldfish cones.J Gen Physiol. 2000 Jan;115(1):3-16. doi: 10.1085/jgp.115.1.3. J Gen Physiol. 2000. PMID: 10613914 Free PMC article.
-
Intrinsic cone adaptation modulates feedback efficiency from horizontal cells to cones.J Gen Physiol. 1999 Oct;114(4):511-24. doi: 10.1085/jgp.114.4.511. J Gen Physiol. 1999. PMID: 10498670 Free PMC article.
-
The involvement of glutamate-gated channels in negative feedback from horizontal cells to cones.Prog Brain Res. 2005;147:219-29. doi: 10.1016/S0079-6123(04)47017-4. Prog Brain Res. 2005. PMID: 15581709 Review.
-
The feedback pathway from horizontal cells to cones. A mini review with a look ahead.Vision Res. 1999 Jul;39(15):2449-68. doi: 10.1016/s0042-6989(99)00043-7. Vision Res. 1999. PMID: 10396615 Review.
Cited by
-
Fovea-like Photoreceptor Specializations Underlie Single UV Cone Driven Prey-Capture Behavior in Zebrafish.Neuron. 2020 Jul 22;107(2):320-337.e6. doi: 10.1016/j.neuron.2020.04.021. Epub 2020 May 29. Neuron. 2020. PMID: 32473094 Free PMC article.
-
Teleost polarization vision: how it might work and what it might be good for.Philos Trans R Soc Lond B Biol Sci. 2011 Mar 12;366(1565):742-56. doi: 10.1098/rstb.2010.0211. Philos Trans R Soc Lond B Biol Sci. 2011. PMID: 21282178 Free PMC article. Review.
-
Kinetics of Inhibitory Feedback from Horizontal Cells to Photoreceptors: Implications for an Ephaptic Mechanism.J Neurosci. 2016 Sep 28;36(39):10075-88. doi: 10.1523/JNEUROSCI.1090-16.2016. Epub 2016 Sep 28. J Neurosci. 2016. PMID: 27683904 Free PMC article.
-
Extracellular potentials modify the transfer of information at photoreceptor output synapses in the blowfly compound eye.J Neurosci. 2010 Jul 14;30(28):9557-66. doi: 10.1523/JNEUROSCI.6122-09.2010. J Neurosci. 2010. PMID: 20631184 Free PMC article.
-
Extracellular ATP hydrolysis inhibits synaptic transmission by increasing ph buffering in the synaptic cleft.PLoS Biol. 2014 May 20;12(5):e1001864. doi: 10.1371/journal.pbio.1001864. eCollection 2014 May. PLoS Biol. 2014. PMID: 24844296 Free PMC article.
References
-
- Asi H, Perlman I. Neural interactions between cone photoreceptors and horizontal cells in the turtle (Mauremys caspica) retina. Visual Neuroscience. 1998;15:1–13. - PubMed
-
- Ayoub GS, Korenbrot JI, Copenhagen DR. Release of endogenous glutamate from isolated cone photoreceptors of the lizard. Neuroscience Report Supplement. 1989;10:S47–S56. - PubMed
-
- Barbur JL, Dunn GM, Wilson JA. The perception of moving comets at high retinal illuminance levels: a rod-cone interaction effect. Biological Cybernetics. 1986;55:145–158. - PubMed
-
- Burr D. Motion smear. Nature. 1980;284:164–165. - PubMed
-
- Copenhagen DR, Jahr CE. Release of endogenous excitatory amino acids from turtle photoreceptors. Nature. 1989;341:537–539. - PubMed
Publication types
MeSH terms
Substances
LinkOut - more resources
Full Text Sources
Miscellaneous