. 2001 Jul 16;194(2):189-203.
doi: 10.1084/jem.194.2.189.

Defective gp130-mediated signal transducer and activator of transcription (STAT) signaling results in degenerative joint disease, gastrointestinal ulceration, and failure of uterine implantation

Affiliations

Defective gp130-mediated signal transducer and activator of transcription (STAT) signaling results in degenerative joint disease, gastrointestinal ulceration, and failure of uterine implantation

M Ernst et al. J Exp Med. .

Abstract

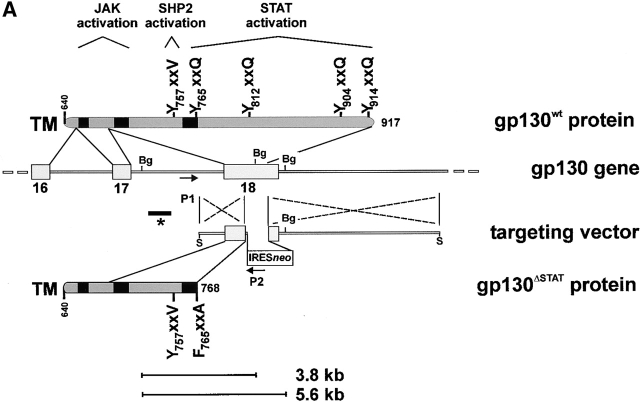
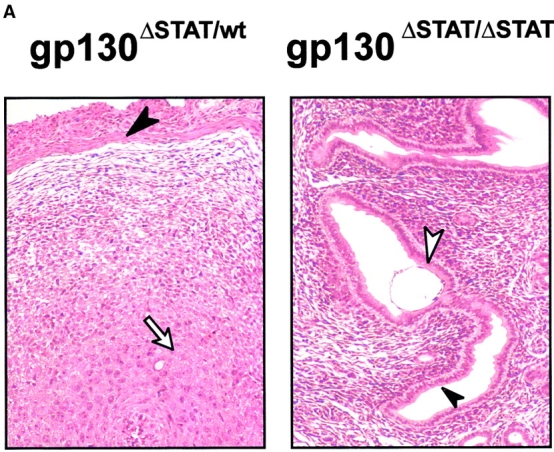
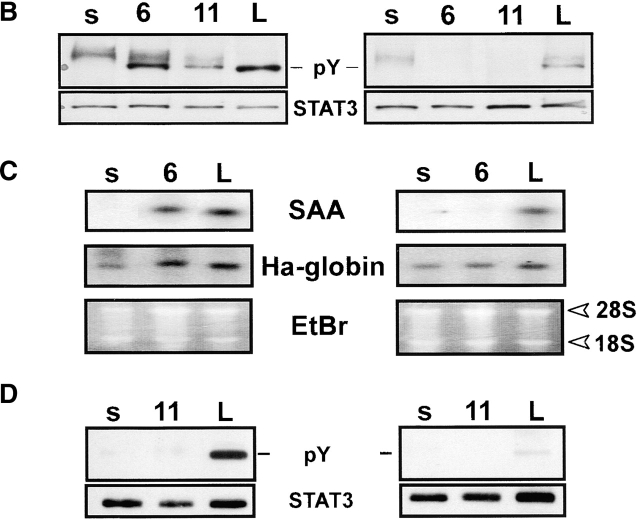
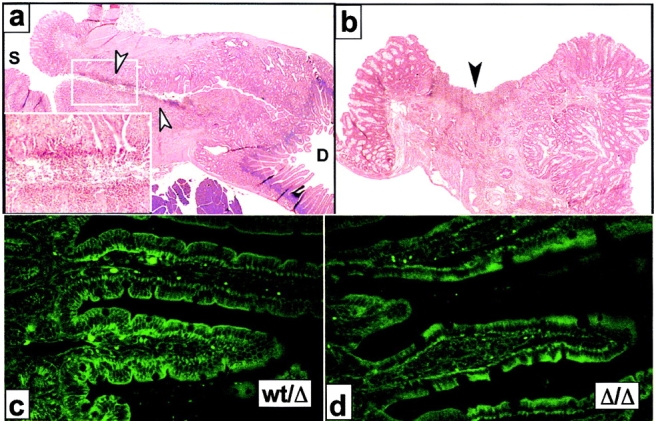
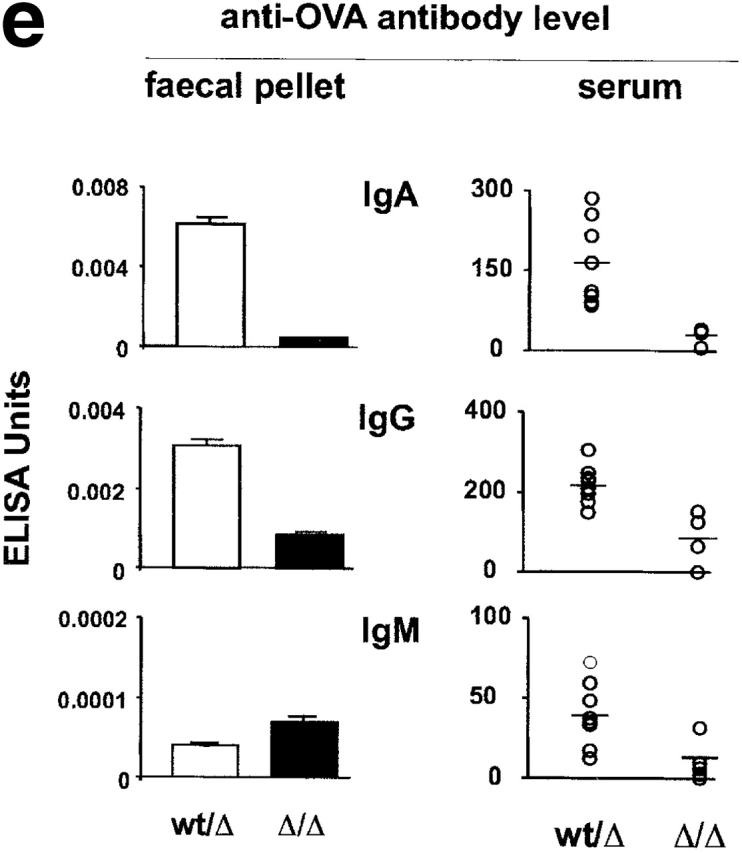
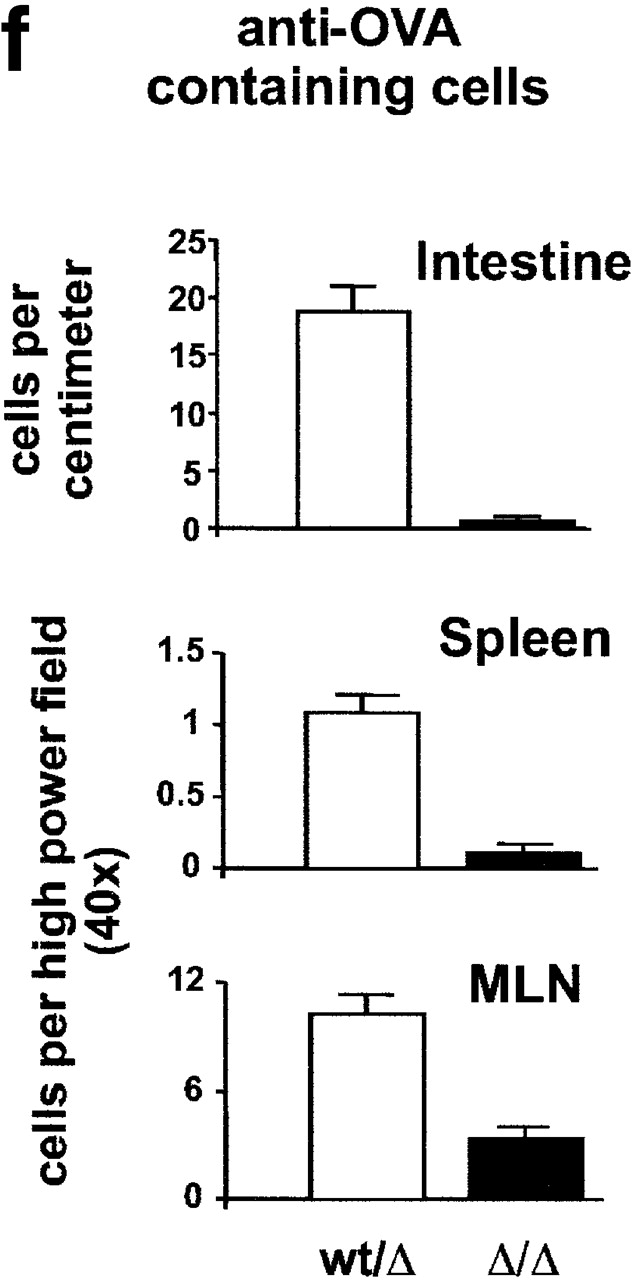
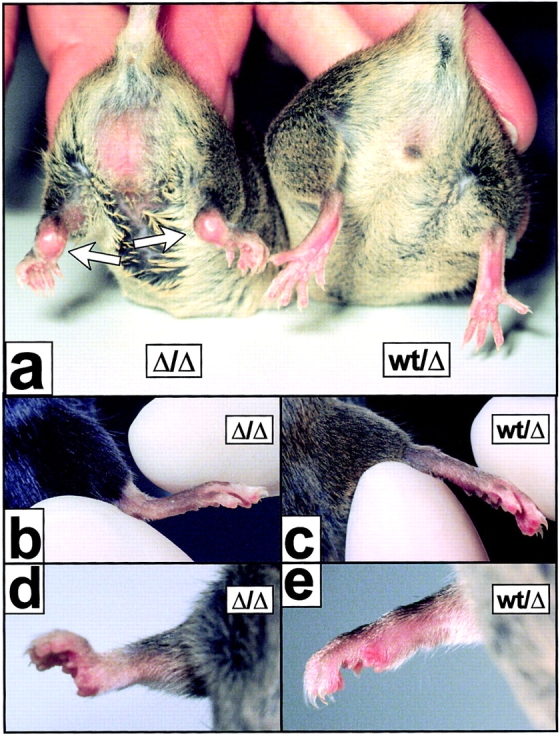
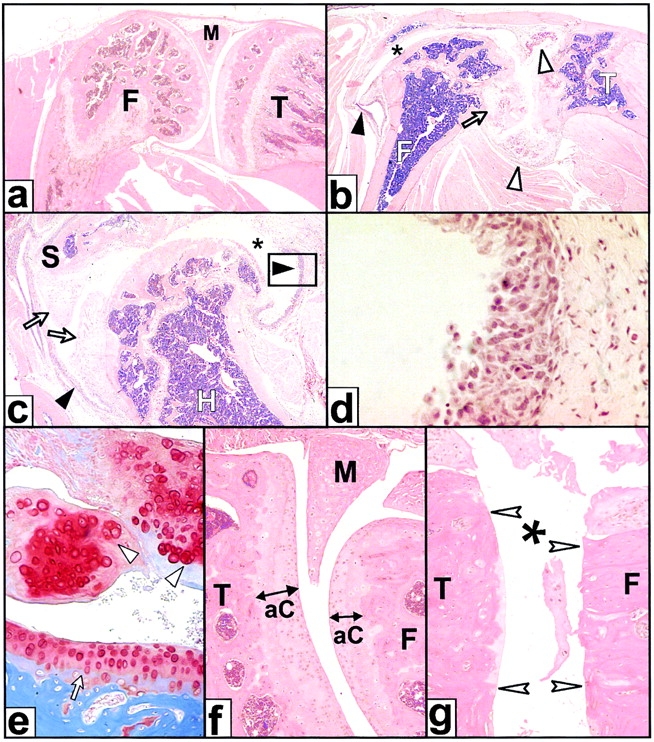
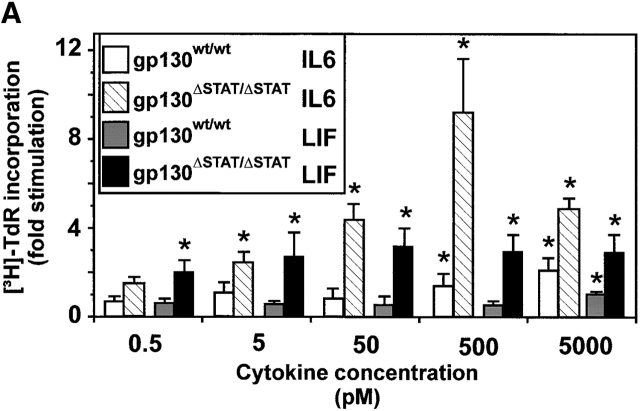
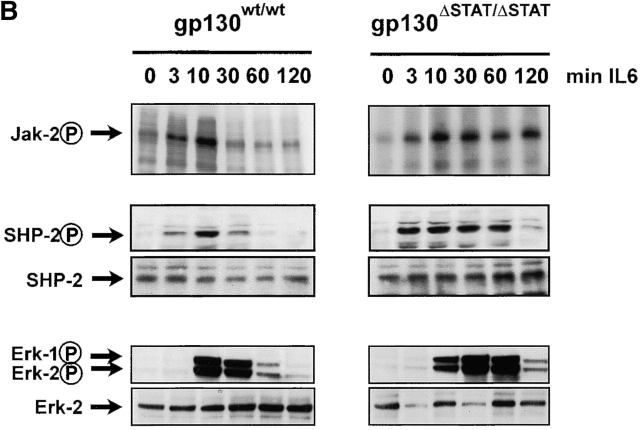
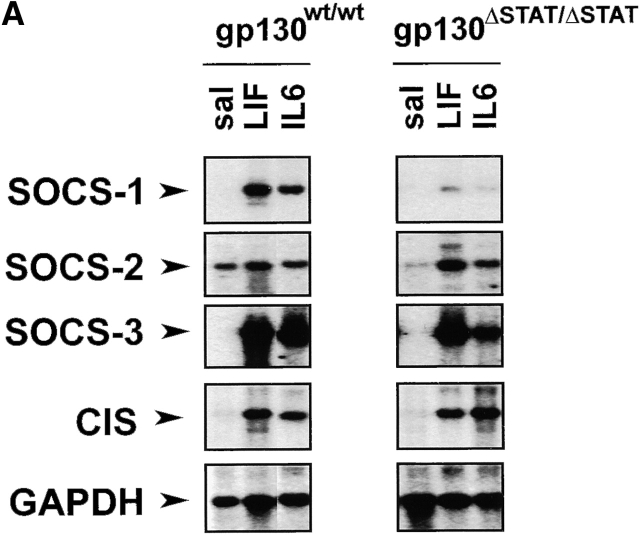
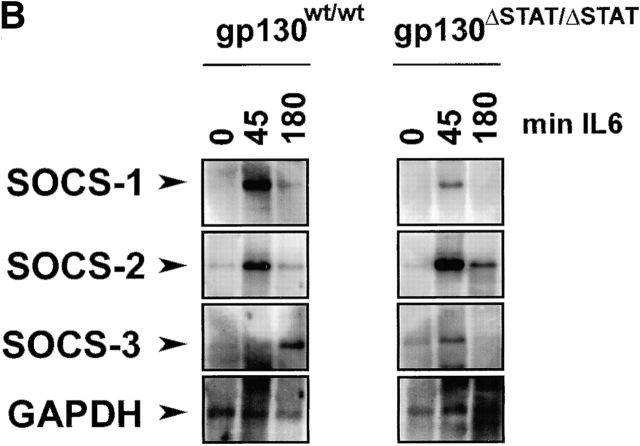
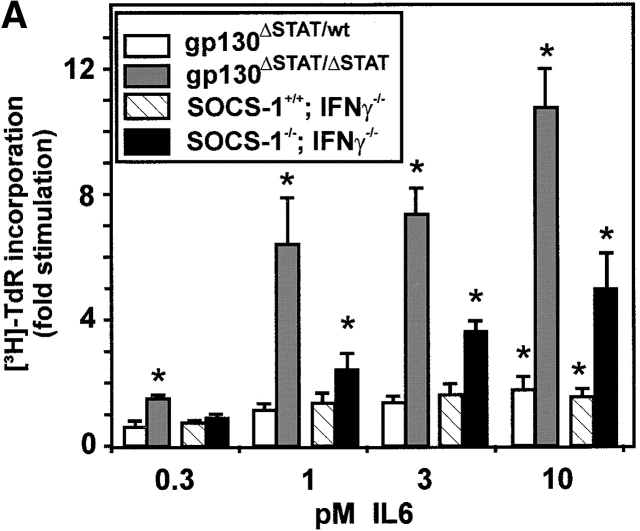
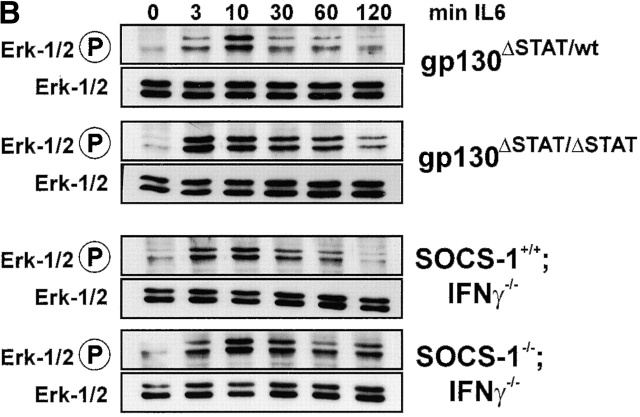
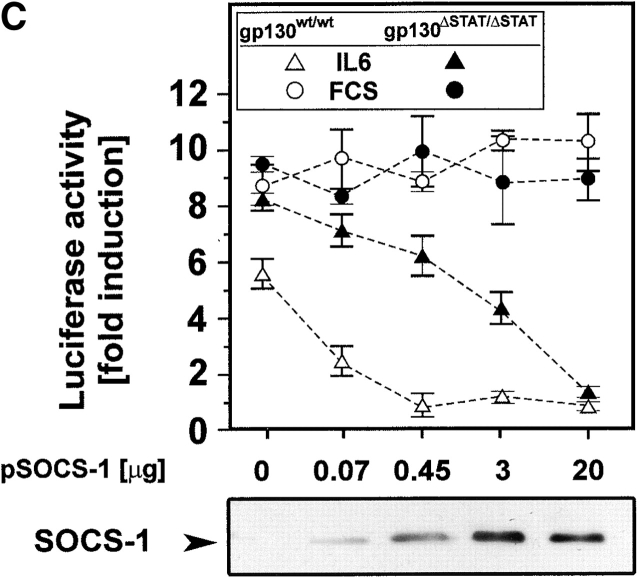
The receptor subunit gp130 transduces multiple cell type-specific activities of the leukemia inhibitory factor (LIF)/interleukin (IL)-6 family of cytokines through the signal transducer and activator of transcription (STAT) and src homology 2 domain-bearing protein tyrosine phosphatase (SHP)-2/ras/Erk pathways. To define STAT-dependent physiological responses, we generated mice with a COOH-terminal gp130(DeltaSTAT) "knock-in" mutation which deleted all STAT-binding sites. gp130(DeltaSTAT) mice phenocopyed mice deficient for IL-6 (impaired humoral and mucosal immune and hepatic acute phase responses) and LIF (failure of blastocyst implantation). However, unlike mice with null mutations in any of the components in the gp130 signaling pathway, gp130(DeltaSTAT) mice also displayed gastrointestinal ulceration and a severe joint disease with features of chronic synovitis, cartilaginous metaplasia, and degradation of the articular cartilage. Mitogenic hyperresponsiveness of synovial cells to the LIF/IL-6 family of cyto-kines was caused by sustained gp130-mediated SHP-2/ras/Erk activation due to impaired STAT-mediated induction of suppressor of cytokine signaling (SOCS) proteins which normally limits gp130 signaling. Therefore, the joint pathology in gp130(DeltaSTAT) mice is likely to arise from the disturbance of the otherwise balanced activation of the SHP-2/ras/Erk and STAT signaling cascades emanating from gp130.


Figures

Figure 1
Figure 1
Generation of gp130ΔSTAT/ΔSTAT mice. (A) Targeting strategy for the introduction of the gp130ΔSTAT truncation. The cytoplasmic domain of mouse gp130 with its homology motifs Box1, Box2, and Box3 (black) are schematically depicted alongside the corresponding genomic structure with exons numbered according to Betz et al. (reference 31). The targeting vector contains a Y765RHQ768 to FRHA substitution and a translational stop codon at position 769 preceding a ribosomal reentry site and the sequence encoding neomycin resistance (IRESneo). A diagnostic digest with BglII (Bg) yields a fragment of 3.8 kb from the wt allele and a 5.6-kb fragment from the targeted allele when hybridized with a probe external to the targeting vector (*). P1 and P2 refer to primers used for an allele-specific PCR reaction. S, SalI. (B) Southern blot analysis of BglII digests of DNA prepared from a targeted ES cell line and tail biopsies obtained from offspring of gp130ΔSTAT/wt intercrosses. The immobilized DNA was hybridized with a probe (* in A) external to the targeting construct. (C) Northern blot analysis of liver RNA extracted from offspring of gp130ΔSTAT/wt matings. Poly(A)+ RNA was hybridized with a cDNA fragment encoding the extracellular portion of gp130. Dicistronic gp130ΔSTAT-neo mRNA transcripts were ∼1.4 kb larger than the two major wt gp130 mRNA species. The same blot was stripped and reprobed for expression of the neo gene.
Figure 1
Figure 1
Generation of gp130ΔSTAT/ΔSTAT mice. (A) Targeting strategy for the introduction of the gp130ΔSTAT truncation. The cytoplasmic domain of mouse gp130 with its homology motifs Box1, Box2, and Box3 (black) are schematically depicted alongside the corresponding genomic structure with exons numbered according to Betz et al. (reference 31). The targeting vector contains a Y765RHQ768 to FRHA substitution and a translational stop codon at position 769 preceding a ribosomal reentry site and the sequence encoding neomycin resistance (IRESneo). A diagnostic digest with BglII (Bg) yields a fragment of 3.8 kb from the wt allele and a 5.6-kb fragment from the targeted allele when hybridized with a probe external to the targeting vector (*). P1 and P2 refer to primers used for an allele-specific PCR reaction. S, SalI. (B) Southern blot analysis of BglII digests of DNA prepared from a targeted ES cell line and tail biopsies obtained from offspring of gp130ΔSTAT/wt intercrosses. The immobilized DNA was hybridized with a probe (* in A) external to the targeting construct. (C) Northern blot analysis of liver RNA extracted from offspring of gp130ΔSTAT/wt matings. Poly(A)+ RNA was hybridized with a cDNA fragment encoding the extracellular portion of gp130. Dicistronic gp130ΔSTAT-neo mRNA transcripts were ∼1.4 kb larger than the two major wt gp130 mRNA species. The same blot was stripped and reprobed for expression of the neo gene.
Figure 2
Figure 2
Failure of blastocyst implantation due to impaired signaling through heterodimeric gp130ΔSTAT/LIF-Rβ complexes. (A) Histological sections through the uteri from a gp130ΔSTAT/wt and gp130ΔSTAT/ΔSTAT mouse 5.5 d after coitum. The blastocyst (white arrowhead) in the gp130ΔSTAT/ΔSTAT uterus showed no signs of implantation. In contrast, the developing embryo is surrounded by stromal cells forming the secondary decidua (white arrow) beneath the epithelial lining (black arrowhead) of the gp130ΔSTAT/wt uterus. (B) Tyrosine phosphorylation (pY) of STAT3 immunoprecipitates prepared from liver of gp130ΔSTAT/wt control and gp130ΔSTAT/ΔSTAT mutant mice 20 min after a single intraperitoneal injection of 5 μg of IL-6 6, IL-11 11, LIF (L), or saline (s). The membranes were reprobed for STAT3 to assess equality of protein loading. Note occasional appearance of a nonspecific band above STAT3. (C) Steady-state levels of mRNA for hepatic type I acute phase proteins extracted from livers of mice as in B. 3 μg of poly(A)+ RNA were hybridized with radiolabeled full length cDNAs encoding human serum amyloid A (SAA) or haptoglobin (Ha-globin). Ethidium bromide (EtBr) stain of the gels revealed similar amounts of RNA analyzed. (D) Tyrosine phosphorylation (pY) of STAT3 immunoprecipitates prepared from uteri of mice treated as in B. The membranes were reprobed for STAT3 to assess equality of protein loading.
Figure 2
Figure 2
Failure of blastocyst implantation due to impaired signaling through heterodimeric gp130ΔSTAT/LIF-Rβ complexes. (A) Histological sections through the uteri from a gp130ΔSTAT/wt and gp130ΔSTAT/ΔSTAT mouse 5.5 d after coitum. The blastocyst (white arrowhead) in the gp130ΔSTAT/ΔSTAT uterus showed no signs of implantation. In contrast, the developing embryo is surrounded by stromal cells forming the secondary decidua (white arrow) beneath the epithelial lining (black arrowhead) of the gp130ΔSTAT/wt uterus. (B) Tyrosine phosphorylation (pY) of STAT3 immunoprecipitates prepared from liver of gp130ΔSTAT/wt control and gp130ΔSTAT/ΔSTAT mutant mice 20 min after a single intraperitoneal injection of 5 μg of IL-6 6, IL-11 11, LIF (L), or saline (s). The membranes were reprobed for STAT3 to assess equality of protein loading. Note occasional appearance of a nonspecific band above STAT3. (C) Steady-state levels of mRNA for hepatic type I acute phase proteins extracted from livers of mice as in B. 3 μg of poly(A)+ RNA were hybridized with radiolabeled full length cDNAs encoding human serum amyloid A (SAA) or haptoglobin (Ha-globin). Ethidium bromide (EtBr) stain of the gels revealed similar amounts of RNA analyzed. (D) Tyrosine phosphorylation (pY) of STAT3 immunoprecipitates prepared from uteri of mice treated as in B. The membranes were reprobed for STAT3 to assess equality of protein loading.
Figure 3
Figure 3
Gastrointestinal ulceration and impaired immunity in gp130ΔSTAT/ΔSTAT mice. Mucosal ulcers (arrowheads) in the gastric pylorius (a) and caecum (b). High magnification (insert) shows surface ulcer debris, neutrophil-rich inflammatory exudates, and regenerative changes in adjacent epithelial cells. S, stomach; D, duodenum. (c and d) Appearance of OVA-containing plasma cells in the lamina propria of small intestinal villi in gp130ΔSTAT/wt control (c) and gp130ΔSTAT/ΔSTAT mutant (d) mice detected by FITC-mediated immunofluorescence of anti-OVA antibodies. (e) Isotype-specific anti-OVA antibody response in extracts of fecal pellets and serum of gp130ΔSTAT/ΔSTAT mutant and gp130ΔSTAT/wt control mice. Mice were immunized by injection of OVA directly into Peyer's patches and boosted with OVA 14 d later. OVA-specific Ig levels were determined after a further 5 d as described in Materials and Methods. Mean ± SEM, n = 7. (f) Number of OVA-specific plasma cells in the small intestine, spleen, and mesenteric lymph nodes (MLN) of mice used for the experiment in Fig. 2 E. Data were obtained by immunofluorescent histology with FITC-conjugated goat–anti mouse heavy chain reagent and represent the mean ± SEM in 30–50 randomly selected high power fields per mouse with four mice per group.
Figure 3
Figure 3
Gastrointestinal ulceration and impaired immunity in gp130ΔSTAT/ΔSTAT mice. Mucosal ulcers (arrowheads) in the gastric pylorius (a) and caecum (b). High magnification (insert) shows surface ulcer debris, neutrophil-rich inflammatory exudates, and regenerative changes in adjacent epithelial cells. S, stomach; D, duodenum. (c and d) Appearance of OVA-containing plasma cells in the lamina propria of small intestinal villi in gp130ΔSTAT/wt control (c) and gp130ΔSTAT/ΔSTAT mutant (d) mice detected by FITC-mediated immunofluorescence of anti-OVA antibodies. (e) Isotype-specific anti-OVA antibody response in extracts of fecal pellets and serum of gp130ΔSTAT/ΔSTAT mutant and gp130ΔSTAT/wt control mice. Mice were immunized by injection of OVA directly into Peyer's patches and boosted with OVA 14 d later. OVA-specific Ig levels were determined after a further 5 d as described in Materials and Methods. Mean ± SEM, n = 7. (f) Number of OVA-specific plasma cells in the small intestine, spleen, and mesenteric lymph nodes (MLN) of mice used for the experiment in Fig. 2 E. Data were obtained by immunofluorescent histology with FITC-conjugated goat–anti mouse heavy chain reagent and represent the mean ± SEM in 30–50 randomly selected high power fields per mouse with four mice per group.
Figure 4
Figure 4
Clinical assessment of the joint disease in gp130ΔSTAT/ΔSTAT mice. Swollen ankle joints and characteristic flexion deformities of hind legs in bilaterally affected gp130ΔSTAT/ΔSTAT mice (a). The restriction of ankle movement (b and c) and fixed flexion deformation of front paws (d and e) were consistent findings in gp130ΔSTAT/ΔSTAT mice but were never seen in gp130ΔSTAT/wt littermates.
Figure 5
Figure 5
Histological assessment of joint disease in gp130ΔSTAT/ΔSTAT mice. Sagittal sections of knees of age-matched 71-d-old gp130ΔSTAT/wt control (a) and gp130ΔSTAT/ΔSTAT mutant mice (b). The section of the mutant knee shows enlargement of the synovial space (*), synovial hyperplasia and pannus formation (black arrowhead), cartilaginous overgrowth in the menicsi (white arrowhead), and destruction and deformation of the articular surfaces. Note that the cartilaginous metaplasia on the head of the femur (arrow) is associated with alterations of the growth plate. The shoulder (c) joint of gp130ΔSTAT/ΔSTAT mouse illustrates the early stage manifested as enlargement of the synovial space (*), prominent synovial hyperplasia (arrowheads), exuberant pannus formation with early cartilaginous metaplasia (arrows) but little destruction of the articular surface. A high magnification (d) of the area boxed in c shows synovial hyperplasia in the recess of the cavity of the shoulder joint. The metaplastic cartilage deposits within the synovial cavity (e) contain disorganized clusters of chondrocytes (arrowhead) which occupy lacunae within the matrix and contrast the organized appearance of smaller chondrocytes in “columns” in normal articular cartilage (arrow); Safranin-O and Alcian Blue stain proteoglycan red and mineralized matrix blue, respectively. Frontal sections through knees from 180-d-old gp130Δ/wt (f) and gp130Δ/Δ mice (g) document the expanded synovial space (*), destruction, and erosion of the articular cartilage (aC arrowhead). aC, articular cartilage; F, femur; H, humerus; M, meniscus; S, scapula; T, tibia.
Figure 6
Figure 6
Hyperresponsiveness of synovial cells correlates with sustained Erk MAPK activation. (A) [3H]thymidine incorporation by synovial cells prepared from wt and gp130ΔSTAT/ΔSTAT mice and stimulated with LIF or IL-6. Cells derived from clinically unaffected joints were stimulated for 24 h with the indicated concentration of LIF or IL-6 in the presence of sIL-6R (500 ng/ml). Each point represents the mean ± SD. *P < 0.05 compared with unstimulated cultures of the same genotype. (B) Activation of intermediate signaling molecules in synovial cells stimulated with IL-6 and sIL-6R (both at 500 ng/ml) for the indicated period of time. Cell lysates were immunoprecipitated with either a Jak-2 antiserum and incubated with γ-[32P]ATP to assess Jak-2 autophosphorylation, or with a SHP-2 antiserum and blotted with antiphosphotyrosine antibodies. Erk MAPK activation was analyzed by directly probing lysates with an antibody specific for phospho-Erk1/2 (Erk-P). The total amount of SHP-2 and Erk proteins was assessed by reprobing the membranes for SHP-2 and Erk1/2, respectively.
Figure 6
Figure 6
Hyperresponsiveness of synovial cells correlates with sustained Erk MAPK activation. (A) [3H]thymidine incorporation by synovial cells prepared from wt and gp130ΔSTAT/ΔSTAT mice and stimulated with LIF or IL-6. Cells derived from clinically unaffected joints were stimulated for 24 h with the indicated concentration of LIF or IL-6 in the presence of sIL-6R (500 ng/ml). Each point represents the mean ± SD. *P < 0.05 compared with unstimulated cultures of the same genotype. (B) Activation of intermediate signaling molecules in synovial cells stimulated with IL-6 and sIL-6R (both at 500 ng/ml) for the indicated period of time. Cell lysates were immunoprecipitated with either a Jak-2 antiserum and incubated with γ-[32P]ATP to assess Jak-2 autophosphorylation, or with a SHP-2 antiserum and blotted with antiphosphotyrosine antibodies. Erk MAPK activation was analyzed by directly probing lysates with an antibody specific for phospho-Erk1/2 (Erk-P). The total amount of SHP-2 and Erk proteins was assessed by reprobing the membranes for SHP-2 and Erk1/2, respectively.
Figure 7
Figure 7
Impaired induction of SOCS mRNA in response to signaling through gp130ΔSTAT. (A) SOCS/CIS mRNA steady-state levels after cytokine stimulation in vivo. Northern blot analysis of poly(A)+ RNA extracted from livers of gp130ΔSTAT/ΔSTAT and wt mice 40 min after a single intravenous injection of 5 μg of LIF, IL-6, or saline. Blots were sequentially probed for SOCS-1, SOCS-2, SOCS-3, CIS, and finally GAPDH to assess for amounts of RNA analyzed. (B) Induction of SOCS-1 and SOCS-3 mRNA steady-state levels in synovial cells stimulated with IL-6 and sIL-6R for the indicated period of time. Northern blots analysis of poly(A)+ RNA probed for SOCS-1, SOCS-3, and GAPDH to assess for amounts of RNA analyzed.
Figure 7
Figure 7
Impaired induction of SOCS mRNA in response to signaling through gp130ΔSTAT. (A) SOCS/CIS mRNA steady-state levels after cytokine stimulation in vivo. Northern blot analysis of poly(A)+ RNA extracted from livers of gp130ΔSTAT/ΔSTAT and wt mice 40 min after a single intravenous injection of 5 μg of LIF, IL-6, or saline. Blots were sequentially probed for SOCS-1, SOCS-2, SOCS-3, CIS, and finally GAPDH to assess for amounts of RNA analyzed. (B) Induction of SOCS-1 and SOCS-3 mRNA steady-state levels in synovial cells stimulated with IL-6 and sIL-6R for the indicated period of time. Northern blots analysis of poly(A)+ RNA probed for SOCS-1, SOCS-3, and GAPDH to assess for amounts of RNA analyzed.
Figure 8
Figure 8
Impaired SOCS induction enhances IL-6 and LIF responsiveness. (A) Mitogenic hyperresponsiveness of SOCS-1–deficient synovial cells to IL-6. [3H]thymidine incorporation assays were carried out on primary cultures of syonvial cells, derived from mice of the indicated genotype, in the presence of the indicated concentration of IL-6 and sIL-6R (500 ng/ml) as described in the legend to Fig. 5 a. Each point represents the mean ± SD. *P < 0.05 compared with unstimulated cultures of the same genotype. (B) SOCS-1–deficient cells show sustained activation of Erk1/2 in response to IL-6. Erk MAPK phosphorylation assay of synovial fibroblasts stimulated for the indicated time with IL-6 and sIL-6R (both at 500 ng/ml) as described in Fig. 5 b. Erk1/2-P indicates the phosphorylated isoforms of Erk1 and Erk2. The total amount of Erk protein was assessed by reprobing the membranes for Erk1/2. (C) Hyperresponsiveness of synovial cells to IL-6 is corrected by overexpressing SOCS-1. Synovial cells were transiently transfected with a fos-luc reporter construct, the Srα-β-gal control plasmid and increasing concentrations of a Flag-epitope tagged SOCS-1 (pSOCS-1) expression construct, stimulated for 48 h with human IL-6 plus sIL-6R (both at 500 ng/ml) or 10% FCS as a positive control. Luciferase activity was normalized by reference to β-galactosidase activity and is expressed as fold induction over unstimulated cultures. The level of SOCS-1Flag protein was assessed at the end of the experiment by immunoprecipitation and Western blotting using anti-Flag antibodies. Each point represents the mean ± SD.
Figure 8
Figure 8
Impaired SOCS induction enhances IL-6 and LIF responsiveness. (A) Mitogenic hyperresponsiveness of SOCS-1–deficient synovial cells to IL-6. [3H]thymidine incorporation assays were carried out on primary cultures of syonvial cells, derived from mice of the indicated genotype, in the presence of the indicated concentration of IL-6 and sIL-6R (500 ng/ml) as described in the legend to Fig. 5 a. Each point represents the mean ± SD. *P < 0.05 compared with unstimulated cultures of the same genotype. (B) SOCS-1–deficient cells show sustained activation of Erk1/2 in response to IL-6. Erk MAPK phosphorylation assay of synovial fibroblasts stimulated for the indicated time with IL-6 and sIL-6R (both at 500 ng/ml) as described in Fig. 5 b. Erk1/2-P indicates the phosphorylated isoforms of Erk1 and Erk2. The total amount of Erk protein was assessed by reprobing the membranes for Erk1/2. (C) Hyperresponsiveness of synovial cells to IL-6 is corrected by overexpressing SOCS-1. Synovial cells were transiently transfected with a fos-luc reporter construct, the Srα-β-gal control plasmid and increasing concentrations of a Flag-epitope tagged SOCS-1 (pSOCS-1) expression construct, stimulated for 48 h with human IL-6 plus sIL-6R (both at 500 ng/ml) or 10% FCS as a positive control. Luciferase activity was normalized by reference to β-galactosidase activity and is expressed as fold induction over unstimulated cultures. The level of SOCS-1Flag protein was assessed at the end of the experiment by immunoprecipitation and Western blotting using anti-Flag antibodies. Each point represents the mean ± SD.

Similar articles

Cited by

References

    1. Heinrich P.C., Behrmann I., Muller-Newen G., Schaper F., Graeve L. Interleukin-6-type cytokine signaling through the gp130/Jak/STAT pathway. Biochem. J. 1998;334:297–314. - PMC - PubMed
    1. Taga T., Kishimoto T. Gp130 and the interleukin-6 family of cytokines. Annu. Rev. Immunol. 1997;15:797–819. - PubMed
    1. Waring P. Leukemia inhibitory factor. In: Garland J.M., editor. Colony Stimulating Factors, Molecular and Cellular Biology. Second ed. Marcel Dekker Publishers; New York: 1997. pp. 467–513.
    1. Kopf M., Baumann H., Freer G., Freudenberg M., Lamers M., Kishimoto T., Zinkernagel R., Bluethmann H., Kohler G. Impaired immune and acute-phase responses in interleukin-6-deficient mice. Nature. 1994;368:339–342. - PubMed
    1. Ramsay A.J., Husband A.J., Ramshaw I.A., Bao S., Matthaei K.I., Koehler G., Kopf M. The role of interleukin-6 in mucosal IgA antibody responses in vivo. Science. 1994;264:561–563. - PubMed

MeSH terms