Comparative Study
. 2001 Aug;183(16):4823-38.
doi: 10.1128/JB.183.16.4823-4838.2001.

Genome sequence and comparative analysis of the solvent-producing bacterium Clostridium acetobutylicum

Affiliations
Comparative Study

Genome sequence and comparative analysis of the solvent-producing bacterium Clostridium acetobutylicum

J Nölling et al. J Bacteriol. 2001 Aug.

Abstract

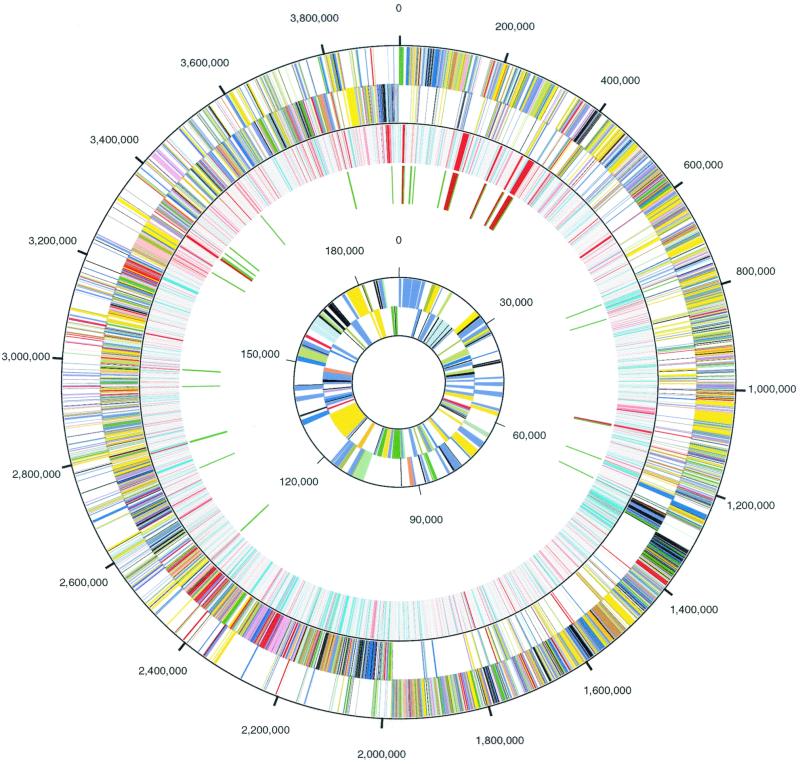
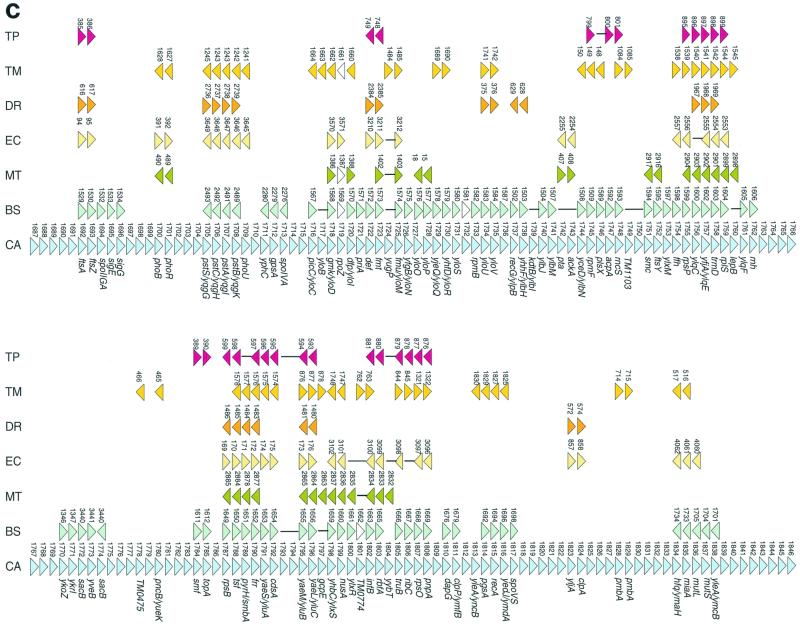
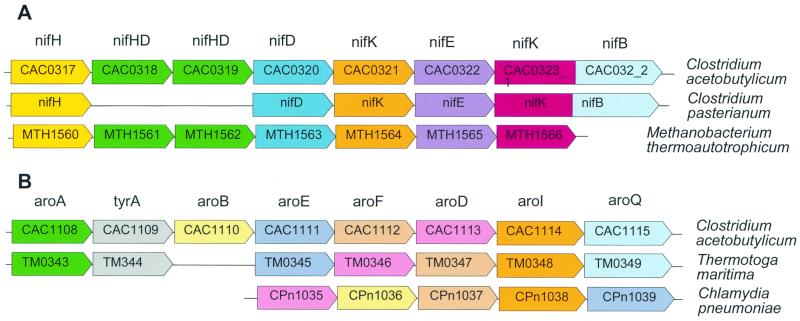
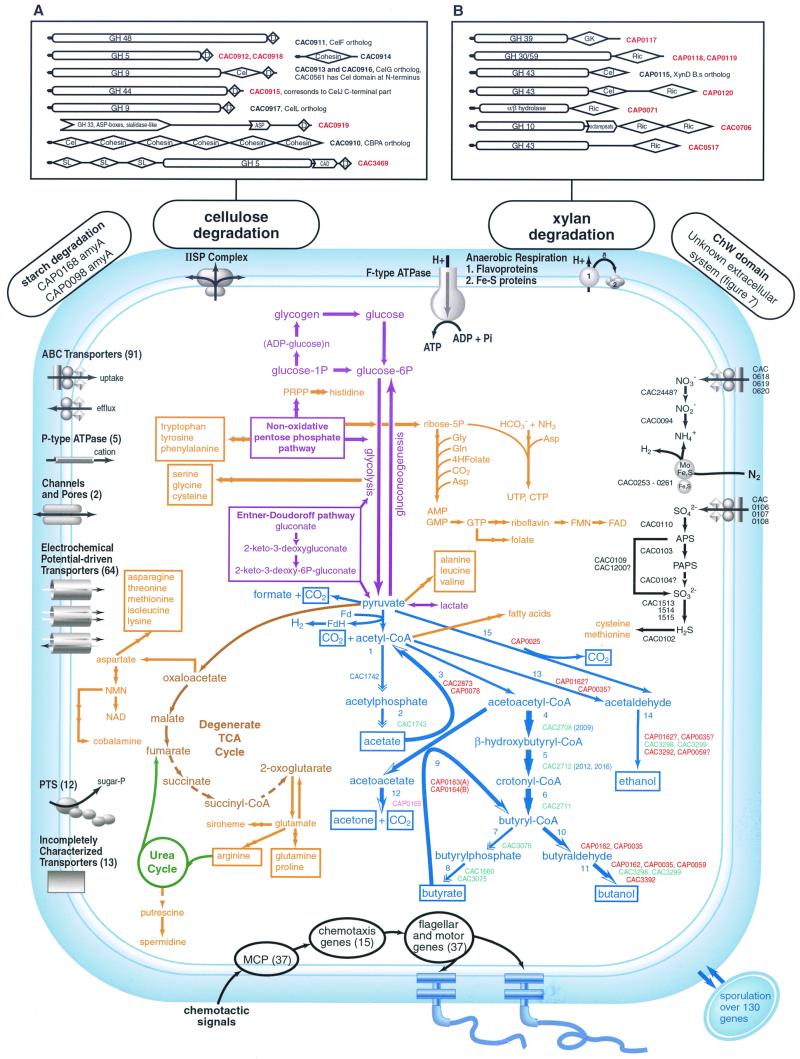
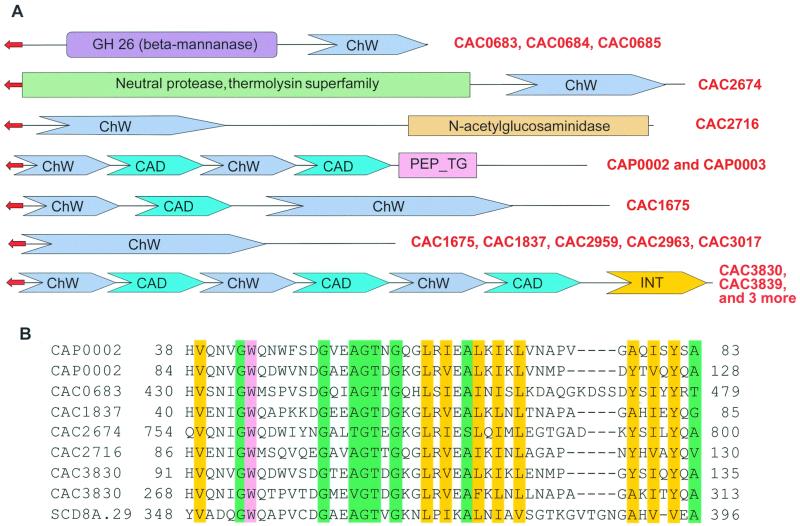
The genome sequence of the solvent-producing bacterium Clostridium acetobutylicum ATCC 824 has been determined by the shotgun approach. The genome consists of a 3.94-Mb chromosome and a 192-kb megaplasmid that contains the majority of genes responsible for solvent production. Comparison of C. acetobutylicum to Bacillus subtilis reveals significant local conservation of gene order, which has not been seen in comparisons of other genomes with similar, or, in some cases closer, phylogenetic proximity. This conservation allows the prediction of many previously undetected operons in both bacteria. However, the C. acetobutylicum genome also contains a significant number of predicted operons that are shared with distantly related bacteria and archaea but not with B. subtilis. Phylogenetic analysis is compatible with the dissemination of such operons by horizontal transfer. The enzymes of the solventogenesis pathway and of the cellulosome of C. acetobutylicum comprise a new set of metabolic capacities not previously represented in the collection of complete genomes. These enzymes show a complex pattern of evolutionary affinities, emphasizing the role of lateral gene exchange in the evolution of the unique metabolic profile of the bacterium. Many of the sporulation genes identified in B. subtilis are missing in C. acetobutylicum, which suggests major differences in the sporulation process. Thus, comparative analysis reveals both significant conservation of the genome organization and pronounced differences in many systems that reflect unique adaptive strategies of the two gram-positive bacteria.


Figures

FIG. 1
FIG. 1
Circular representation of the C. acetobutylicum genome and megaplasmid. The outer two rings indicate the positions of genes on the forward and reverse strands of the genome, respectively, color-coded by function. Moving inward, the third ring indicates the G+C content of each putative gene: turquoise (≤27%), gray (27 to 35%), pink-red (>35%); the fourth ring indicates the positions of tRNA (green) and rRNA genes (dark red). The inner rings show the positions of genes on the forward and reverse strands of pSOL1, respectively, color-coded by function (the distance scale for the inner rings differs from the scale of the outer rings, as indicated). The functional color-coding is as follows: energy production and conversion, dark olive; cell division and chromosome partitioning, light blue; amino acid transport and metabolism, yellow; nucleic acid transport and metabolism, orange; carbohydrate transport and metabolism, gold; coenzyme metabolism, tan; lipid metabolism, salmon; translation, ribosome structure, and biogenesis, pink; transcription, olive drab; DNA replication, recombination, and repair, forest green; cell envelope biogenesis, outer membrane, red; cell motility and secretion, plum; posttranslational modification, protein turnover, and chaperones, purple; inorganic ion transport and metabolism, dark sea green; general function prediction only, dark blue; conserved protein, function unknown, medium blue; signal transduction mechanisms, light purple; predicted membrane protein, light green; hypothetical protein, black.
FIG. 2
FIG. 2
Taxonomic distribution of the closest homologs of C. acetobutylicum proteins. Undiscriminated, ORFs whose phylogenetic affinities remained unclear. Abbreviations: G+, gram positive; B/C, Bacillus/Clostridium; Cl, C. acetobutylicum.
FIG. 3
FIG. 3
Conservation of gene order in C. acetobutylicum and other bacteria and archaea. (a) A genome dot plot comparison of E. coli (ecoli) and P. aeruginosa (paer). The numbers on the axes indicate the gene numbers in the corresponding genome. Each large unit corresponds to 200 genes, and each small unit corresponds to 100 genes. The red dots indicate protein alignments with a score density of >1.3 bit/position, and the blue dots indicate alignments with a score density of 0.8 to 1.3 bit/position. (b) A genome dot plot comparison of C. acetobutylicum (cac) and B. subtilis (bsub). (c) A comparison of genome organization in bacterial and archaeal genomes in the longest region of conserved gene order between C. acetobutylicum and B. subtilis. Abbreviations: TP, T. pallidum; TM, T. maritima; DR, D. radiodurans; EC, E. coli; MT, M. thermoautotrophicum; BS, B. subtilis; CA, C. acetobutylicum. The protein-coding genes in all genomes are denoted by numbers, starting from the first gene in the corresponding GenBank records. The white triangles show genes that are not homologous to the corresponding C. acetobutilicum genes. In gene strings that contain deletions compared to the C. acetobutylicum genome, the missing genes are replaced by lines joining the genes that are adjacent in the given genome. For each gene of C. acetobutylicum, the gene name of the ortholog in B. subtilis (or in another genome if a B. subtilis ortholog was not detectable) is indicated.
FIG. 3
FIG. 3
Conservation of gene order in C. acetobutylicum and other bacteria and archaea. (a) A genome dot plot comparison of E. coli (ecoli) and P. aeruginosa (paer). The numbers on the axes indicate the gene numbers in the corresponding genome. Each large unit corresponds to 200 genes, and each small unit corresponds to 100 genes. The red dots indicate protein alignments with a score density of >1.3 bit/position, and the blue dots indicate alignments with a score density of 0.8 to 1.3 bit/position. (b) A genome dot plot comparison of C. acetobutylicum (cac) and B. subtilis (bsub). (c) A comparison of genome organization in bacterial and archaeal genomes in the longest region of conserved gene order between C. acetobutylicum and B. subtilis. Abbreviations: TP, T. pallidum; TM, T. maritima; DR, D. radiodurans; EC, E. coli; MT, M. thermoautotrophicum; BS, B. subtilis; CA, C. acetobutylicum. The protein-coding genes in all genomes are denoted by numbers, starting from the first gene in the corresponding GenBank records. The white triangles show genes that are not homologous to the corresponding C. acetobutilicum genes. In gene strings that contain deletions compared to the C. acetobutylicum genome, the missing genes are replaced by lines joining the genes that are adjacent in the given genome. For each gene of C. acetobutylicum, the gene name of the ortholog in B. subtilis (or in another genome if a B. subtilis ortholog was not detectable) is indicated.
FIG. 4
FIG. 4
Horizontally transferred operons in C. acetobutylicum. (a) Conservation of the nitrogenase operon in two species of Clostridium and M. thermoautotrophicum. (b) Conservation of the aromatic amino acid biosynthesis operon in C. acetobutylicum, T. maritima, and Chlamydia pneumoniae. Orthologs are shown by the same color.
FIG. 5
FIG. 5
Overview of the basic metabolic pathways in C. acetobutylicum. The pathways are color coded as follows: catabolism of hydrocarbohydrates to pyruvate, purple; (incomplete) TCA cycle, brown; solventogenesis, blue; biosynthetic pathways, orange; urea cycle, forest green; nitrate and sulfate reduction and nitrogen fixation, black. Reactions for which no certain candidate enzyme was found are shown by dashed arrows. Phylogenetic affinities of genes of solventogenesis are shown by color: red for proteobacterial affinity; light green for Bacillus/Clostridium group; magenta for archaea. Genes with uncertain affinity are in blue. Different arrow shapes show that the respective genes are organized in operons. Numbers in the solventogenesis pathway correspond to the following enzymes: 1, phosphotransacetylase; 2, acetatekinase; 3, thiolase; 4, beta-hydroxybutyryl-CoA dehydrogenase; 5, crotonase; 6, butyryl-CoA dehydrogenase; 7, phosphotransbutyrylase; 8, butyrate kinase; 9, acetoacetyl-CoA:acyl-CoA transferase; 10, butyraldehyde dehydrogenase; 11, butanol dehydrogenase; 12, acetoacetate decarboxylase; 13, acetaldehyde dehydrogenase; 14, ethanol dehydrogenase; 15, pyruvate decarboxylase. Transporters are grouped by major categories, and the total number of transporters of each group is indicated in parentheses. The number of ABC transporters was estimated as the number of ABC-type ATPases. A more detailed breakdown of the transporters follows. ABC-type uptake transporters: nitrate, sulfate, phosphate, molybdate, ferrichrome, spermidine/putrescine, ribose, peptide, glycerol-3P (one of each); proline/glycine betaine, multidrug/protein/lipid (two paralogs of each); iron, cobalt (three paralogs); sugar, amino acid (five copies); oligopeptide (six copies). ABC-type efflux transporters: polysaccharide, Na+, (one of each), various specificities, homologous to eukaryotic P-glycoprotein (32 paralogs). P-type ATPases: K+, heavy metal (one of each), cation (three paralogs). Channels and pores: chloride, potassium (one of each). Electrochemical-driven transporters: formate/nitrite, ammonium, C4-dicarboxylate, proton/sodium-glutamate, transporter of cations and cationic drugs, 2-oxoglutarate/malate translocator (one of each); Na+/H+ antiporter, gluconate/proton symporter (two paralogs), Mn2+/H+ transporter, NRAMP family, Na:galactoside symporter family, Co/Zn/Cd symporter (four paralogs), amino acid transporters (12 paralogs), sugar-proton symporter (30 paralogs). PTS (phosphoenolpyruvate-dependant phosphotransferase system): mannitol, fructose, cellobiose, fructose (mannose), galactitol/fructose, lactose, N-acetylglucosamine, arbutin (one of each); glucose, beta-glucosides (two paralogs). Incompletely characterized transporters: xanthine, uracil, arsenite efflux pump (one of each); magnesium and cobalt transporter ferrous iron transport FeoA/FeoB (two paralogs), O-antigen transporter family (six paralogs). Abbreviations: IISP, type II general secretory pathway; PRPP, phosphoribosyl-pyrophosphate; 4Hfolate, tetrahydrofolate; APS, adenylylsulphate; PAPS, phosphoadenylylsulfate; MPS, methyl-accepting chemotaxis protein. Domain architectures of proteins involved in cellulose (A) and xylan degradation (B). Domain name abbreviations: D, dockerin; Ric, ricin; Cel, cellulose binding; SL, S layer; CAD, cell adhesion domain; GK, “Greek key” domain. Signal peptide is shown by an arrow. Gene identifiers of proteins with unique domain organizations are in red.
FIG. 6
FIG. 6
Novel signal transduction operons in C. acetobutylicum. Paralogs are shown by the same color (pattern). Domain organization is shown above the boxes with gene identifiers. See the key in the bottom of the figure and additional details in the text.
FIG. 7
FIG. 7
A predicted novel extracellular macromolecular system based on proteins containing the previously uncharacterized ChW repeats. Domain name abbreviations: CAD, cell adhesion domain; INT, intrenalin-related domain; PEP_TG, predicted peptidase of transglutaminase family. Signal peptide is shown by a red arrow. Gene identifiers of proteins with unique domain organizations are in red. (A) The domain architectures of the proteins with ChW repeats. (B) Multiple alignment of ChW repeats in selected proteins from C. acetobutylicum; SCD8A0.29 is an S. coelicolor protein. The highlighting shows conserved amino acid residues. A yellow background indicates hydrophobic residues (A, C, F, I, L, M, V, W, Y, G), a green background indicates small residues (A, C, S, T, D, N, V, G, P), and magenta color indicates aromatic residues (W, Y, F). The numbers indicate the positions of the first and last residues of the aligned region in each protein sequence.

References

    1. Altschul S F, Koonin E V. Iterated profile searches with PSI-BLAST—a tool for discovery in protein databases. Trends Biochem Sci. 1998;23:444–447. - PubMed
    1. Altschul S F, Madden T L, Schaffer A A, Zhang J, Zhang Z, Miller W, Lipman D J. Gapped BLAST and PSI-BLAST: a new generation of protein database search programs. Nucleic Acids Res. 1997;25:3389–3402. - PMC - PubMed
    1. Bahl H, Mueller H, Behrens S, Joseph H, Narberhaus F. Expression of heat shock genes in Clostridium acetobutylicum. FEMS Microbiol Rev. 1995;17:341–348. - PubMed
    1. Bayer E A, Shimon L J, Shoham Y, Lamed R. Cellulosomes—structure and ultrastructure. J Struct Biol. 1998;124:221–234. - PubMed
    1. Blanchet, D., R. Marchal, and J. P. Vandecasteele. 1985. Acetone and butanol by fermentation of inulin. French patent 2559160.

Publication types