. 2001 Aug 1;21(15):5439-48.
doi: 10.1523/JNEUROSCI.21-15-05439.2001.

Paralytic zebrafish lacking acetylcholine receptors fail to localize rapsyn clusters to the synapse

Affiliations

Paralytic zebrafish lacking acetylcholine receptors fail to localize rapsyn clusters to the synapse

F Ono et al. J Neurosci. .

Abstract

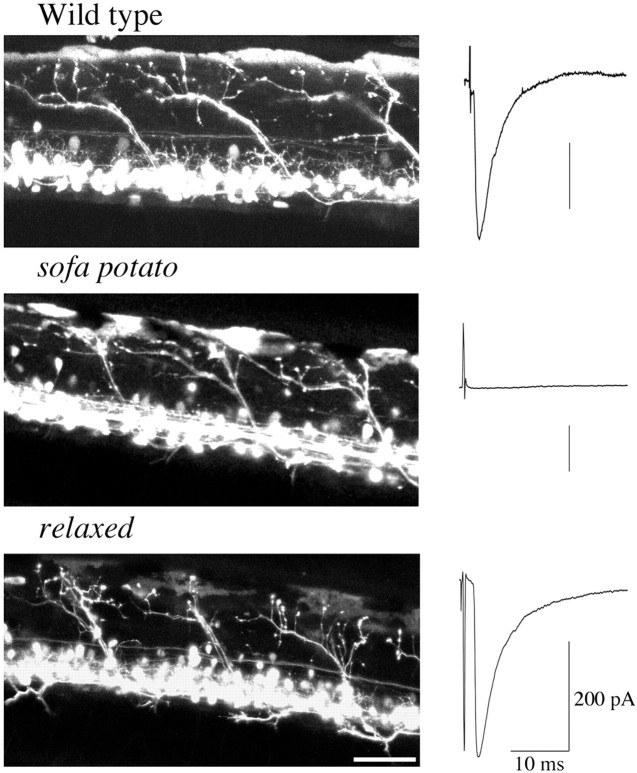
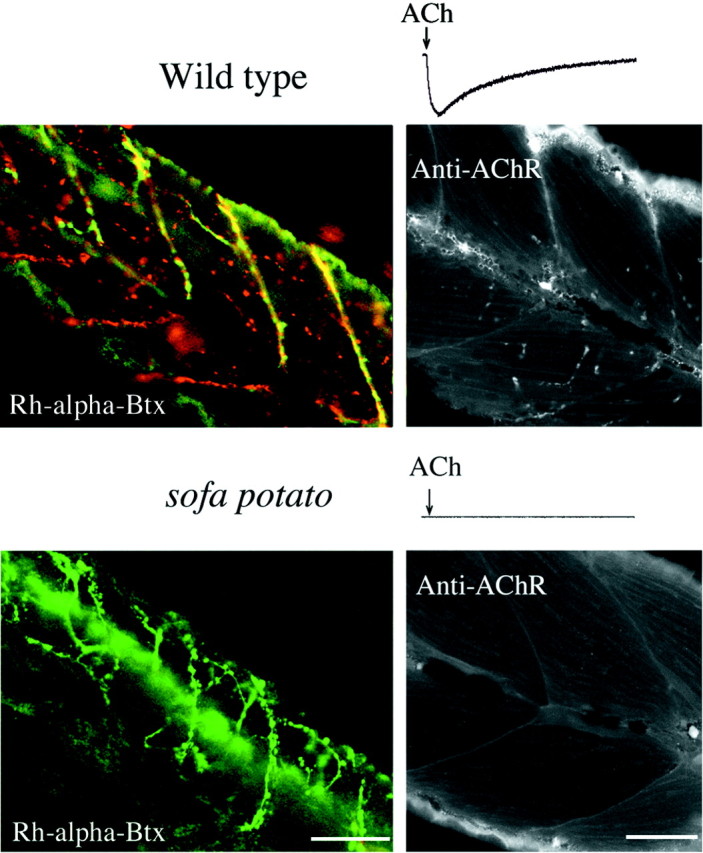
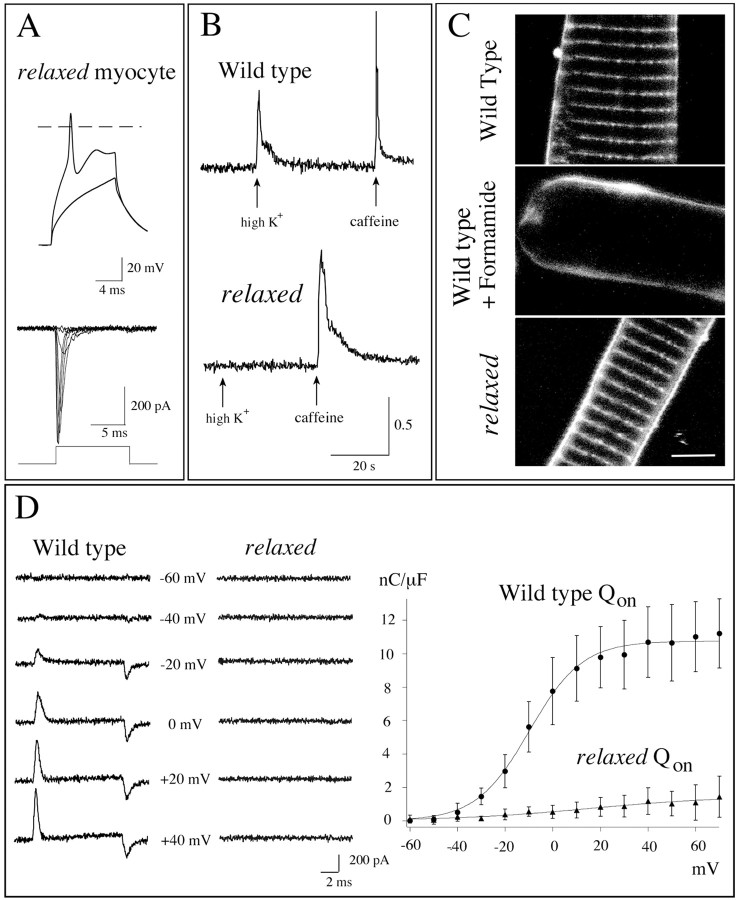
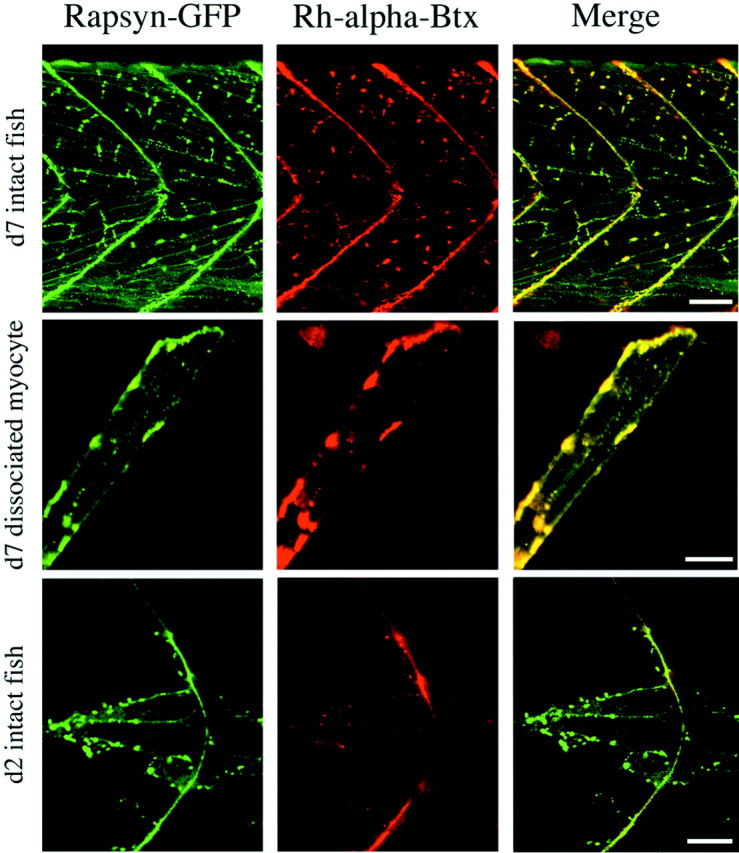
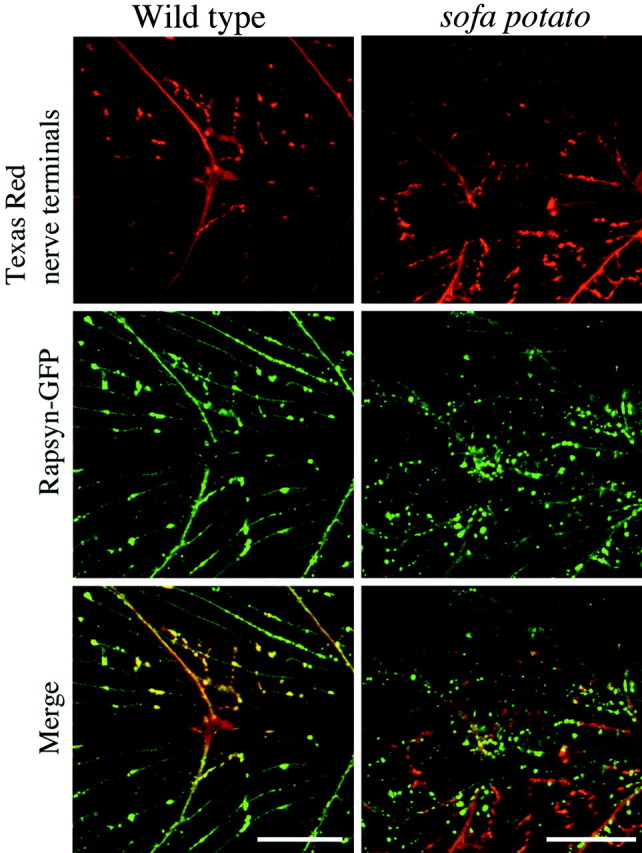
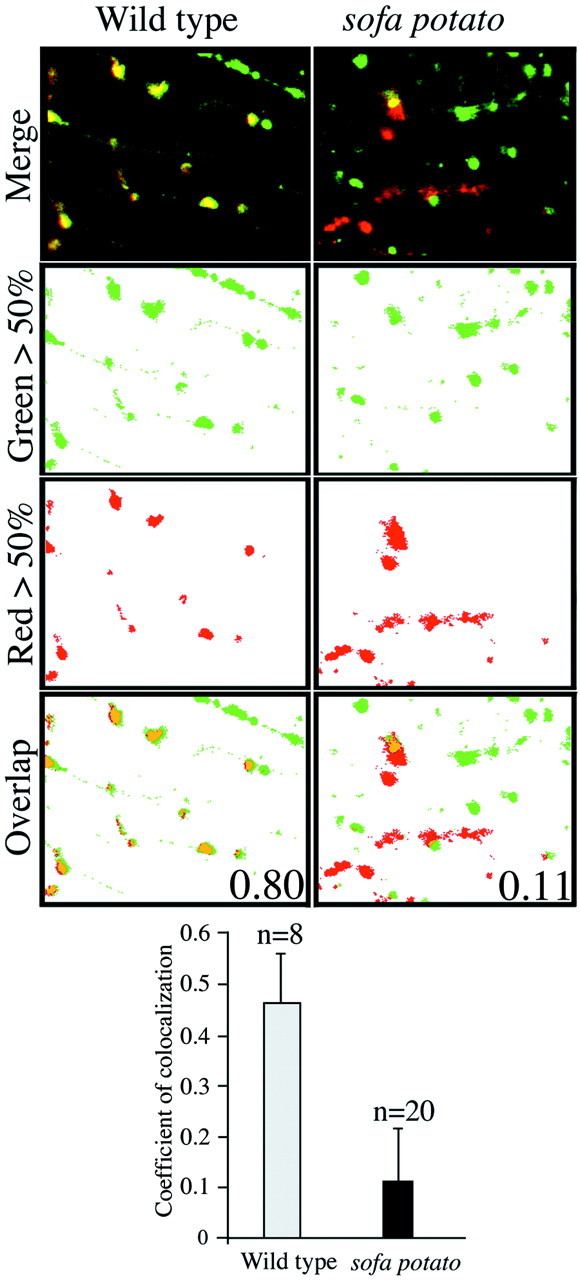
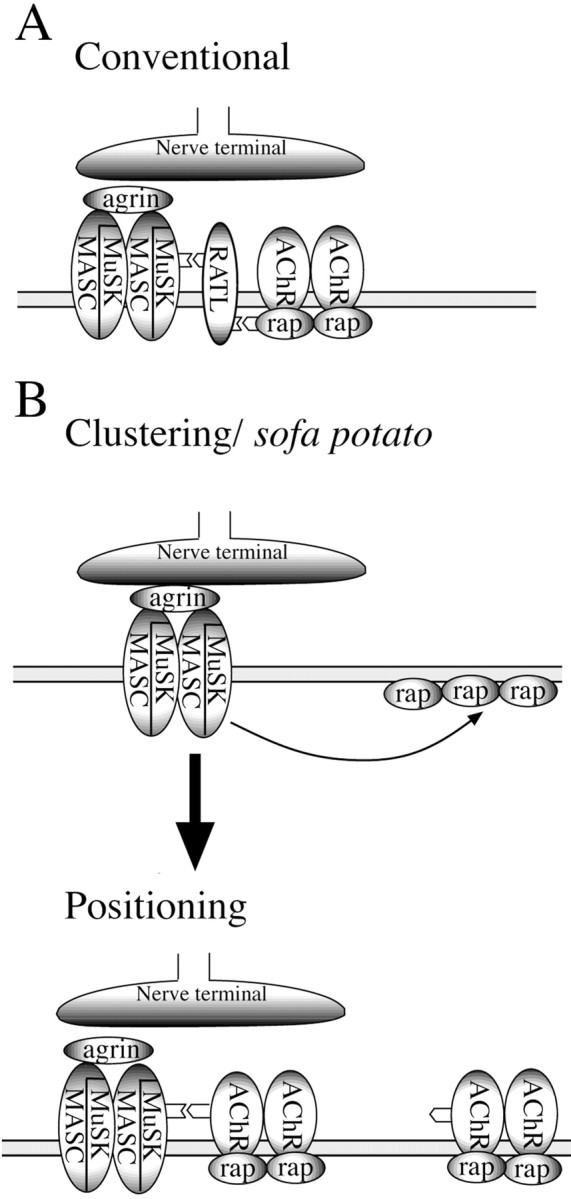
Physiological analysis of two lines of paralytic mutant zebrafish, relaxed and sofa potato, reveals defects in distinct types of receptors in skeletal muscle. In sofa potato the paralysis results from failed synaptic transmission because of the absence of acetylcholine receptors, whereas relaxed mutants lack dihydropyridine receptor-mediated release of internal calcium in response to the muscle action potential. Synaptic structure and function appear normal in relaxed, showing that muscle paralysis per se does not impede proper synapse development. However, sofa potato mutants show incomplete development of the postsynaptic complex. Specifically, in the absence of ACh receptors, clusters of the receptor-aggregating protein rapsyn form in the extrasynaptic membrane but generally fail to localize to the subsynaptic region. Our results indicate that, although rapsyn molecules are capable of self-aggregation, interaction with ACh receptors is required for proper subsynaptic localization.


Figures

Fig. 1.
Fig. 1.
Expression of cytoplasmic GFP in motor neurons of wild-type and mutant fish. Left, The somas and axons of secondary motor neurons expressing the GFP are visualized (see Materials and Methods). The stacked images were obtained from intact fish because of the transparency of the skin. The skin exhibits autofluorescence that can be detected along the top edge of the body. The wild-type and both mutant fish were 5 d old. Scale bar, 50 μm. Right, Electrophysiological recordings of evoked synaptic currents from voltage-clamped muscle cells after extracellular stimulations of spinal cord (see Materials and Methods). The stimulus artifact precedes the synaptic response in muscle. Note the lack of response in sofa potato muscle.
Fig. 2.
Fig. 2.
Labeling of ACh receptors by α-bungarotoxin and immunohistochemistry. Shown is the response of muscle cells from 5-d-old wild-type (top trace) and sofa potato (bottom trace) fish to transiently applied 10 μm ACh. Note the lack of response bysofa potato muscle. Muscle from wild-type/Isl1-GFP (top) and sofa potato/Isl1-GFP (bottom) lines was treated with rhodamine-α-bungarotoxin. In the top panel thered fluorescence in wild-type muscle corresponds to the location of ACh receptors. The green fluorescence from the cytoplasmic GFP indicates the location of axons and synaptic terminals. The plane of focus was set at a different level from the spinal cord so that the somata of motor neurons are not seen. Insofa potato fish (bottom) thegreen fluorescence resulting from GFP is observed, but no red fluorescence corresponding to rhodamine-α-Btx is observed. The right panels show black and white images of mAb35 labeling of ACh receptors in fixed muscle from 5-d-old fish. Some autofluorescence from the skin is seen along the edge of the tail. Fluorescence that is associated with the labeling of ACh receptors is absent in sofa potato muscle. Scale bars, 50 μm.
Fig. 3.
Fig. 3.
Relaxed mutant fish show functional defects in DHP receptors. A, Top traces, Voltage records from a dissociated myocyte fromrelaxed fish showing responses to current injection. One trace shows a subthreshold passive response, and a second trace shows a muscle action potential when the stimulus strength was increased. Thedashed line denotes 0 mV. Bottom traces, Inward Na+ currents in response to 10 msec test pulses from muscle cells of relaxed mutant fish. The potential was stepped from −90 mV in 10 mV increments to test potentials ranging from −50 to +10 mV. B, Photometric measurements of intracellular calcium levels in wild-type andrelaxed myocytes. Shown are the changes in ratio of fura-2 AM fluorescence measured at 360 and 390 nm wavelength excitation. The wild-type muscle responses to puffer-applied 52 mm K+ solution and 3 mmcaffeine solution are indicated by the arrows. Muscle from relaxed mutant fish responded to caffeine but failed to respond to high K+ solution.C, Dissociated myotubes from wild-type andrelaxed mutants stained with Di-8-ANNEPS show the distribution of z-bands. Disruption of wild-type T-tubules by treatment with 2 m formamide led to a disappearance of the fluorescence labeling by the dye. Scale bar, 5 μm. D, Whole-cell recordings of charge displacement in myocytes from wild-type and relaxed fish are shown. Traces from muscle cells of similar sizes, capacitance, and age (3 d old) are shown for wild-type and mutant fish. The responses to the test potentials are indicated. The voltage protocols and solutions that were used to eliminate ionic and capacitive currents are indicated in Materials and Methods. In the associated plot the charge movement integrals (Qon) for wild-type (filled circles) and relaxed(filled triangles) fish are plotted against test potential voltages. The mean values and SDs for seven muscle cells are shown. The data are fit according to:Qon =Qmax/{1 + exp [ − (VV1/2Q)/kQ]}, where Qmax is the maximum charge,V1/2Q is the voltage at which one-half of the charge has moved, and kQ is a slope factor. For the fitted curve of wild-typeQon shown in the graph,Qmax = 10.8,V1/2Q = −9.85, andkQ = 11.1.
Fig. 4.
Fig. 4.
Developmental changes in the relationship between ACh receptor and rapsyn–GFP distribution. Left, Rapsyn–GFP distribution in the tail muscle of an intact 7-d-old wild-type/rapsyn–GFP fish (top), dissociated wild-type/rapsyn–GFP myocyte (middle), and 2-d-old wild-type/rapsyn–GFP fish (bottom). Thegreen fluorescence indicates the distribution of rapsyn–GFP. Middle, The distribution of fluorescence associated with the labeling of ACh receptors by rhodamine-α-Btx in the same muscle shown at the left. Right, The green fluorescence associated with the rapsyn–GFP fusion protein and the red fluorescence from the rhodamine-α-Btx-labeled ACh receptors are merged for theleft and middle images. Scale bars:Top, 50 μm; middle, 20 μm;bottom, 10 μm.
Fig. 5.
Fig. 5.
The distribution of rapsyn–GFP fluorescence in 5-d-old sofa potato mutant fish. The distribution of rapsyn–GFP in intact tail muscle (left) and in a dissociated myocyte (right) is shown also. Scale bars:Left, 50 μm; right, 20 μm.
Fig. 6.
Fig. 6.
The rapsyn clusters localize beneath nerve terminals in wild-type fish, but not in sofa potatomutant fish. The distribution of nerve terminal endings for wild-type/rapsyn–GFP (top left) and sofa potato/rapsyn–GFP (top right) lines are shown by red fluorescence. Some, but not all, of the nerve terminals in the field of view were labeled by anterograde filling of the motor neurons with Texas Red-dextran. The distribution of the rapsyn–GFP fusion protein is shown for the same wild-type andsofa potato muscles in the middle panels. The merge is shown in the bottom panels. Scale bars, 50 μm.
Fig. 7.
Fig. 7.
Quantitation of nerve terminal and rapsyn colocalization. The distribution of Texas Red-labeled terminals (red fluorescence) and GFP labeled rapsyn (green fluorescence) are shown for wild-type (left) and sofa potato(right) muscles. In the top panels the merged images of Texas Red and GFP fluorescence distributions with colocalization in yellow are shown. Thesecond and third panels show separate digitally processed images indicating the pixels exceeding the 50% threshold values for red (Red > 50%) or green (Green > 50%) fluorescence intensities. All pixels falling below the detection threshold of 50% were converted to values corresponding towhite. In the bottom panels(Overlap), the red pixels colocalizing with green pixels are coded orange. The coefficients of colocalization for both wild-type and sofa potato, based on the fractional overlap of redpixels by green pixels, are indicated for the images shown. The mean coefficients for the overall data are indicated in the histogram along with the number of fields that were measured and the SDs.
Fig. 8.
Fig. 8.
Two models for the clustering and subsynaptic positioning of ACh receptors. In the conventional model (A) the ACh receptor–rapsyn complex is anchored to synaptic MuSK via interactions with a hypothetical RATL.B, A model based on our findings wherein clustering and positioning occur as separate processes. The final anchoring of the complex to MuSK occurs via the ACh receptor in this model.

Similar articles

Cited by

References

    1. Adams BA, Tanabe T, Mikami A, Numa S, Beam KG. Intramembrane charge movement restored in dysgenic skeletal muscle by injection of dihydropyridine receptor cDNAs. Nature. 1990;346:569–572. - PubMed
    1. Apel ED, Roberds SL, Campbell KP, Merlie JP. Rapsyn may function as a link between the acetylcholine receptor and the agrin-binding dystrophin-associated glycoprotein complex. Neuron. 1995;15:15–26. - PubMed
    1. Apel ED, Glass DJ, Moscoso LM, Yancopoulos GD, Sanes JR. Rapsyn is required for MuSK signaling and recruits synaptic components to a MuSK-containing scaffold. Neuron. 1997;18:623–635. - PubMed
    1. Burden SJ. The formation of neuromuscular synapses. Genes Dev. 1998;12:133–148. - PubMed
    1. Chen Q, Sealock R, Peng HB. A protein homologous to the Torpedo postsynaptic 58K protein is present at the myotendinous junction. J Cell Biol. 1990;110:2061–2071. - PMC - PubMed

Publication types

MeSH terms