. 2001 Jul 31;98(16):9062-7.
doi: 10.1073/pnas.111153598. Epub 2001 Jul 24.

Folding and signaling share the same pathway in a photoreceptor

Affiliations

Folding and signaling share the same pathway in a photoreceptor

B C Lee et al. Proc Natl Acad Sci U S A. .

Abstract

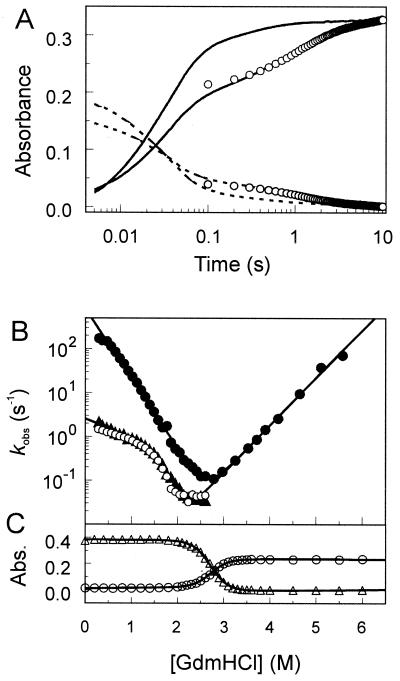
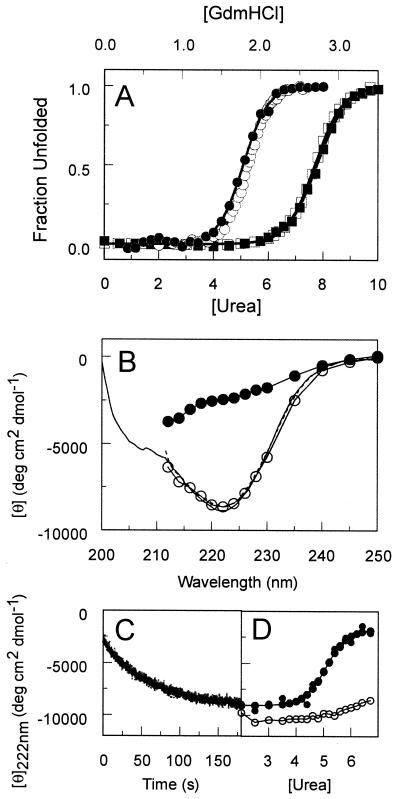
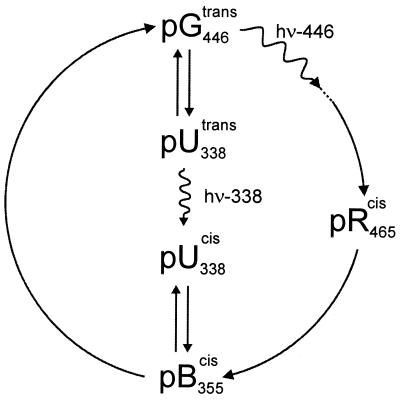
The photoreceptor photoactive yellow protein (PYP) was used as a model system to study receptor activation and protein folding. Refolding was studied by stopped-flow absorbance spectroscopy for PYP with either a trans or a cis chromophore. Chromophore trans to cis isomerization, the mechanism of light detection by PYP, greatly affects the protein folding process. When the cis chromophore is present, refolding from the unfolded state proceeds through the putative signaling state of PYP as an on-pathway intermediate. In addition, moderate denaturant concentrations result in the specific unfolding of the signaling state of PYP. Thus, the signaling state is common to the pathways of folding and signaling. This result provides an avenue for the study of protein folding. We demonstrate how this approach can be used to establish whether a folding intermediate is on-pathway or off-pathway. The results also reveal transient partial unfolding as a molecular mechanism for signaling.


Figures

Figure 1
Figure 1
Protein folding in PYP. (A) The kinetics of refolding in PYP observed by stopped-flow absorbance spectroscopy. Refolding was initiated by a jump in denaturant concentration, obtained by rapid mixing, from 3.5 to 1.0 M GdmHCl at pH 7.0. The resulting kinetics were monitored at 340 (dashed lines) and 445 (solid lines) nm for the refolding of pUtrans (monoexponential decay with k = 31.4 s−1) and a mixture of pUtrans and pUcis generated by the illumination of pUtrans with near-UV light [biexponential decay with k1 = 31.4 s−1 (68%) and k2 = 0.9 s−1 (32%)], The kinetics of the pBcis to pGtrans photocycle transition (○; monoexponential decay with k = 0.9 s−1) were determined under identical conditions, and normalized to match the amplitude of the rapid mixing signals. (B) Chevron analysis of protein folding in PYP. The kinetics of pGtrans unfolding (●) and of pUtrans (●) and pUcis (▴) refolding were determined as a function of GdmHCl concentration. The kinetics of the pBcis to pGtrans photocycle kinetics (○) were determined under identical conditions. The rapid mixing data were fit (solid lines, see Tables 1 and 2) to a two-state model for PYP containing a trans chromophore, and to a model containing an on-pathway intermediate for PYP containing a cis chromophore. (C) Equilibrium denaturation titration of pGtrans to pUtrans with GdmHCl, followed by visible absorbance spectroscopy at 340 nm (○) and 446 nm (▵).
Figure 2
Figure 2
Specific denaturation of the pBcis photocycle intermediate. (A) Equilibrium denaturant titrations of pGtrans (squares) and pBcis (circles) with GdmHCl (closed symbols) and urea (open symbols). The pGtrans denaturation curve was determined from absorbance data at 340 and 446 nm; pBcis denaturation was monitored at 375 nm in the pBcis-pGtrans absorbance difference spectrum. (B) CD spectroscopy of the pUcis state (●) was performed by probing the CD signal during pGtrans recovery after PYP photoexcitation at various wavelengths. The depicted values were obtained by extrapolation to t = 0 (i.e., immediately after closure of the optical shutter for sample illumination) for pUcis (●) and t = ∞ (i.e., after complete pGtrans recovery) for pGtrans (○). The pUcis values were scaled to 100% pGtrans photobleaching, as determined from the measured absorbance values at 446 nm. For comparison, the steady-state CD spectrum of the pGtrans state in the presence of 0 (solid line) and 6.0 (dotted line) M urea are shown. (C) The monoexponential recovery of pGtrans in the presence of 6.0 M urea, detected by CD spectroscopy at 222 nm. (D) The amplitude of the light-induced loss of CD signal at 222 nm extrapolated to t = 0 (●) was determined as a function of urea concentration and scaled to 100% pGtrans photobleaching. ○ depict the dependence of the CD signal for pGtrans at 222 nm.
Figure 3
Figure 3
Integrating folding and signaling in PYP. The folding and photocycle transitions in PYP are depicted schematically. Note that pUcis is an off-pathway intermediate for the photocycle, whereas pBcis is an on-pathway intermediate for pUcis refolding.

References

    1. Takei J, Chu R-A, Bai Y. Proc Natl Acad Sci USA. 2000;97:10796–10801. . (First Published September 12, 2000; 10.1073/pnas.190265797) - PMC - PubMed
    1. Dalby P A, Oliveberg M, Fersht A R. J Mol Biol. 1998;276:625–646. - PubMed
    1. Krantz B A, Sosnick T R. Biochemistry. 2000;39:11696–11701. - PubMed
    1. Fersht A R. Proc Natl Acad Sci USA. 2001;97:14121–14126. . (First Published December 12, 2000; 10.1073/pnas.260502597) - PMC - PubMed
    1. Meyer T E, Yakali E, Cusanovich M A, Tollin G. Biochemistry. 1987;26:418–423. - PubMed

Publication types

Substances

LinkOut - more resources