. 2001 Jul 31;98(16):9185-90.
doi: 10.1073/pnas.151253198. Epub 2001 Jul 24.

Evolutionary self-organization of cell-free genetic coding

Affiliations

Evolutionary self-organization of cell-free genetic coding

R M Füchslin et al. Proc Natl Acad Sci U S A. .

Abstract

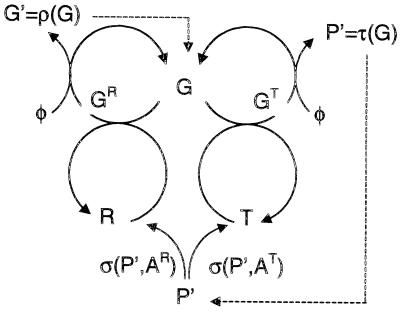
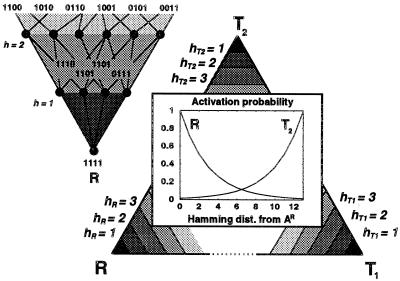
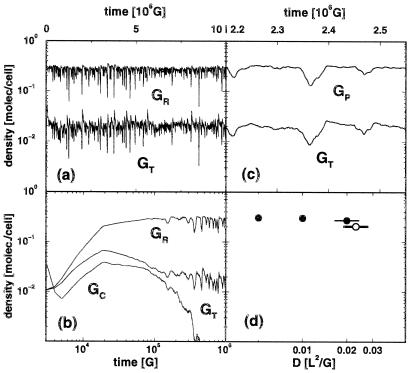
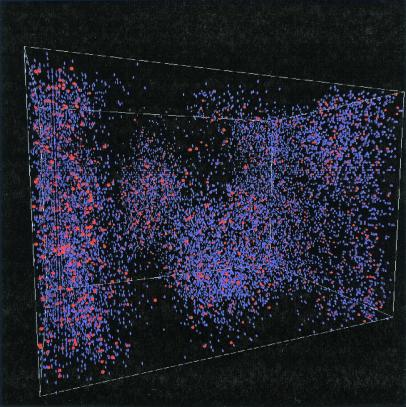
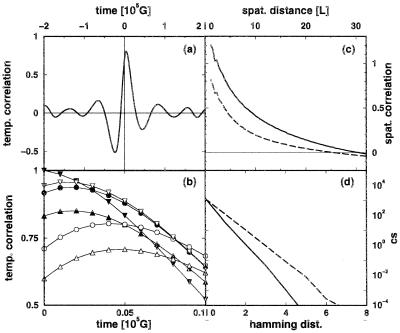
Genetic encoding provides a generic construction scheme for biomolecular functions. This paper addresses the key problem of coevolution and exploitation of the multiple components necessary to implement a replicable genetic encoding scheme. Extending earlier results on multicomponent replication, the necessity of spatial structure for the evolutionary stabilization of the genetic coding system is established. An individual-based stochastic model of interacting molecules in three-dimensional space is presented that allows the evolution of genetic coding to be analyzed explicitly. A massively parallel configurable computer (NGEN) is used to implement the model, on the time scale of millions of generations, directly in electronic hardware. The spatial correlations between components of the genetic coding system are analyzed and found to be essential for evolutionary stability.


Figures

Figure 1
Figure 1
Flow chart of the reaction network given in Table 1. The unimolecular decay processes are not shown.
Figure 2
Figure 2
Catalytic centers in sequence space. (Upper Left) The catalytic center in sequence space for R is given by the sequence 1111 (in practice, longer sequences are used). Assuming a sequence length n, the n!/r!(n − r)! sequences with hamming distance r from the catalytic center have a probability 2ar of being activated into a R. The Lower Right stresses the fact that any sequence has a nonvanishing probability of being activated into any function represented by a catalytic center in the sequence space: replication, R, or one of two different translation schemes; direct, T1, and bit inversion, T2. The triangle is equilateral, implying that the hamming distances between all catalytic centers are equal. This is not exactly the case, but the hamming distances and α are big enough to make any difference negligible.
Figure 3
Figure 3
Time evolution of relevant gene population in the GRT model. The molecules are enclosed in a pool with 88 × 88 × 128 cells. The y axis shows normalized gene densities. The sequences have a length of 26 bits. As parameters, we set: diffusion rate D = 0.02, mutation rate m = 2−9 (per bit), and decay rates for genes and proteins dG = dP = 0.001 (per generation). Both decay rates are equal; this means that the decay may as well be understood as outflow. The probability of accepting a wrong bit in the activation process is set to p = 2−4, and the activation rate of translatases and replicases is α = 0.01 (per generation). All activation and independently all decay rates are set equal, despite the fact that the translatase population could be stabilized at a higher value by tuning these parameters individually. (a) The long-time behavior of the genes coding for replicases (GR) and translatases (GT). (b) A double-logarithmic plot of the same curves showing the four time domains defined in the text. The fate of a subpopulation GC of nonfunctional genes is also shown. (c) The time evolution of genes coding for general nonfunctional proteins (GP) and translatases is given in higher time resolution. (d) The average number of genes coding for replicases as function of the diffusion constant D. Filled circles indicate populations that persist in all calculations (at least 15 million generations). Open symbols stand for populations that may attain a fully reproducing state of organization over several million generations but eventually become extinct. One standard deviation of the average replicase gene number is given by the error bars for D = 0.02 and D = 0.023.
Figure 4
Figure 4
Three-dimensional plot of the replicase (blue) and translatase (red) distribution in the spatially resolved simulation. Simulation parameters were as in Fig. 2. The image was taken after 2.3 × 10⁶ G during the time domain iv after allowing initial transients to subside. The clustering shown is generic to this time domain.
Figure 5
Figure 5
Correlation analysis. a shows the time correlation between translatases and genes coding for replicases. The x axis gives the time in units of 105 G. b presents a more detailed look at the (temporal) translatase autocorrelation (▾), the translatase-replicase correlation (●), and the translatase-parasite correlation (▴). Open symbols stand for the respective translatase–gene correlations. c gives the spatial translatase correlation during time intervals in which the number of translatases is (in total) increasing (solid) or decreasing (dashed). The curves shown are an average over 15,000 individual correlation functions. The correlation functions used take into account the discrete lattice structure. For each cell, there is a finite number c(rj) of other cells with distance rj and a discrete set of possible distances. Defining ni as the number of molecules of type i and N as the total number of cells, the normalized correlation function used is formula image The subscript under the summation sign indicates a summation over the cells occupied by molecules of type i. The coordinates of a cell are given by r⃗i. This definition is based on Grassberger's approach to the correlation dimension (24). An efficient algorithm to evaluate it is described in ref. . In d, the correlation for mutant gene sequences in sequence space is presented for two different catalytic falloff parameters α = 4 (solid) and α = 1 (dashed). The genes in the population are divided into classes Sx, containing the genes that have x + 1 as minimal hamming distance to a catalytic center. The plot shows the size of Sx divided by the number of possible sequences having a minimal hamming distance x + 1 to one of the reference sequences (cs). The intersequence correlation is exponential in this Hamming distance to a good approximation.

References

    1. Knight R D, Landweber L F. Cell. 2000;101:569–572. - PubMed
    1. Dyson F J. J Mol Evol. 1982;18:344–350. - PubMed
    1. Maynard Smith J. Nature (London) 1979;280:445–446. - PubMed
    1. Bresch C, Niesert U, Harnasch D. J Theor Biol. 1980;85:399–405. - PubMed
    1. Boerljist M C, Hogeweg P. Physica D. 1991;48:17–28.

Publication types