. 2001 Jul 31;98(16):9312-7.
doi: 10.1073/pnas.161102498. Epub 2001 Jul 24.

Presenilin-dependent gamma-secretase activity modulates thymocyte development

Affiliations

Presenilin-dependent gamma-secretase activity modulates thymocyte development

P Doerfler et al. Proc Natl Acad Sci U S A. .

Abstract

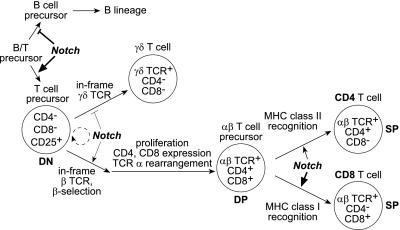
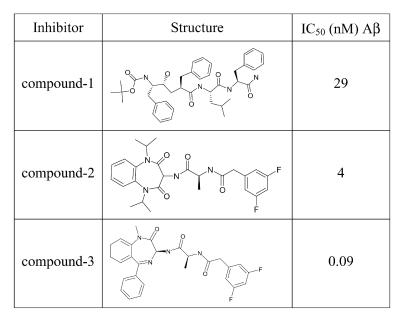
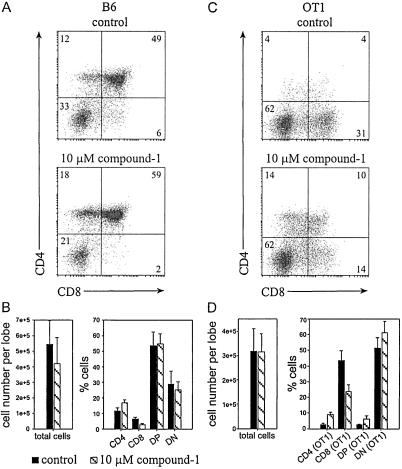
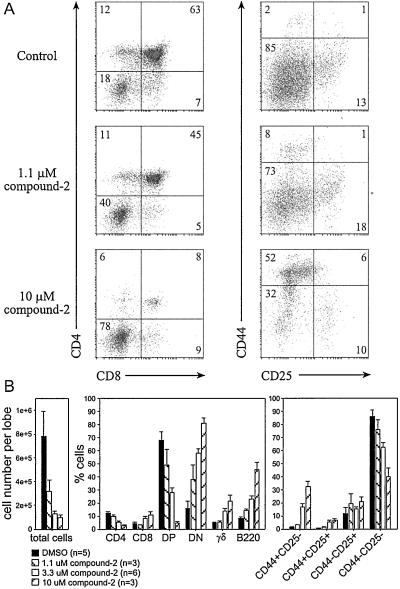
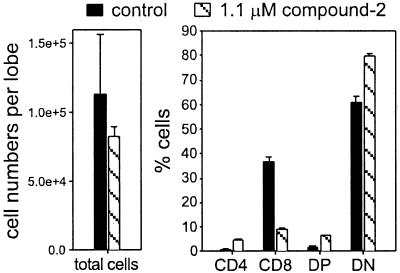
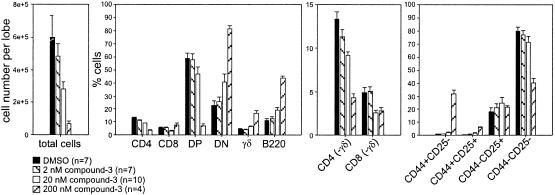
In neuronal cells, presenilin-dependent gamma-secretase activity cleaves amyloid precursor proteins to release Abeta peptides, and also catalyzes the release of the intracellular domain of the transmembrane receptor Notch. Accumulation of aberrant Abeta peptides appears to be causally related to Alzheimer's disease. Inhibition of Abeta peptide production is therefore a potential target for therapeutic intervention. Notch proteins play an important role in cell fate determination in many different organisms and at different stages of development, for example in mammalian T cell development. We therefore addressed whether structurally diverse gamma-secretase inhibitors impair Notch function by studying thymocyte development in murine fetal thymic organ cultures. Here we show that high concentrations of the most potent inhibitors blocked thymocyte development at the most immature stage. In contrast, lower concentrations or less potent inhibitors impaired differentiation at a later stage, most notably suppressing the development of CD8 single-positive T cells. These phenotypes are consistent with an impairment of Notch signaling by gamma-secretase inhibitors and define a strict Notch dose dependence of consecutive stages during thymocyte development.


Figures

Figure 1
Figure 1
A model for Notch involvement in T-lymphoid development (modified from ref. 33). Notch signaling in lymphoid precursor cells in the bone marrow and/or in the thymus favors T-lymphoid over B-lymphoid differentiation. Notch also appears to bias the early differentiation of double-negative (DN) T cell precursors toward the αβ T cell lineage. Finally, Notch promotes positive selection of double-positive (DP) to single-positive (SP) cells with a predominant effect on the selection and/or survival of CD8 cells (see text for details and references).
Figure 2
Figure 2
Structure and activity of selected γ-secretase inhibitors. IC50 (nM) Aβ refers to the compound concentration required to inhibit 50% of Aβ(1–40) formation in human neuroblastoma cells.
Figure 3
Figure 3
γ-Secretase inhibition impairs accumulation of CD8 SP cells in FTOC. C57BL/6 (B6) or OT1 TCR transgenic (OT1) thymocytes were isolated from FTOC after 6 days of culture in the absence (control) or presence of 10 μM compound 1. All cells were stained with PE anti-CD4 and FITC anti-CD8. In the case of OT1, cells were additionally stained with BIO anti-Vα2/SA-TRI to detect cells expressing the transgenic TCR. Flow cytometric profiles for B6 (A) and OT1 (C) are shown as two-dimensional dot blots for the CD4/8 staining with each dot representing a live cell. Numbers in quadrants indicate percentages of cells within respective thymic subpopulations. (B) Bar diagrams summarize B6 results for total cell recovery per lobe and for the relative representation of thymocyte subpopulations, presenting mean values and standard deviations (SD) obtained for nine control and five inhibitor-treated samples within this experiment, which is a representative example of five independent experiments. (D) Bar diagrams summarize OT1 results analogous to B, except that the analysis of thymic subpopulations was electronically restricted to cells expressing the OT1 TCR (Vα2-positive cells). Presented are the means and SD obtained for five control and five inhibitor-treated samples within this experiment, which is representative of three independent experiments.
Figure 4
Figure 4
Potent γ-secretase inhibition causes an early block of T cell development. C57BL/6 FTOC cells were analyzed after 6 days in culture in the absence or presence of 1.1, 3.3, or 10 μM compound 2 γ-secretase inhibitor. (A) Flow cytometric profiles of live cells stained with a combination of PE anti-CD4, FITC anti-CD8, and BIO anti-TCRγδ/SA-TRI or PE anti-CD44, FITC anti-CD25, and BIO anti-B220/SA-TRI. Numbers in quadrants indicate percentages of cells within respective subpopulations. (B) Bar diagrams summarize results for the total cell recovery and thymocyte subpopulations of fetal lobes from littermates under the respective conditions. Shown is a representative example of three independent experiments, presenting means and SD for the indicated sample numbers (n). After determining the number of harvested cells per lobe, groups of two or three thymic lobes treated with 10 μM compound 2 were pooled to provide sufficient cells for flow cytometry, in which case n indicates the number of pools. All other lobes were continuously handled separately.
Figure 5
Figure 5
Low concentrations of a potent γ-secretase inhibitor affect the accumulation of CD8 SP cells similarly to high concentrations of a less potent inhibitor. OT1 TCR transgenic thymocytes were isolated from FTOC after 6 days of culture in the absence (control) or presence of 1.1 μM compound 2. All cells were stained with PE anti-CD4, FITC anti-CD8, and BIO anti-Vα2/SA-TRI. The bar diagrams summarize results for total cell recovery per lobe and for the relative representation of thymocyte subpopulations. Presented are mean values and the range of results obtained for two control and two inhibitor-treated samples, which is a representative example of three similar experiments.
Figure 6
Figure 6
Structurally diverse γ-secretase inhibitors consistently affect thymocyte development in a concentration-dependent manner. C57BL/6 FTOC cells, cultured in various concentrations of the γ-secretase inhibitor compound 3 (0, 2, 20, and 200 nM) for 6 days, were analyzed as described in Fig. 4. CD4(−γδ) and CD8(−γδ) refers to SP cell numbers determined after electronically excluding TCRγδ-positive cells. Shown is a representative example of four experiments, presenting means and SEM for the indicated sample numbers (n). Sample numbers refer to individual thymic lobes except for the condition with 200 nM compound 3, where it refers to the number of pools consisting of 2–3 lobes used for flow cytometric analysis.

References

    1. Brown M S, Ye J, Rawson R B, Goldstein J L. Cell. 2000;100:391–398. - PubMed
    1. Haass C, De Strooper B. Science. 1999;286:916–919. - PubMed
    1. Wolfe M S, Xia W, Ostaszewski B L, Diehl T S, Kimberly W T, Selkoe D J. Nature (London) 1999;398:513–517. - PubMed
    1. Steiner H, Duff K, Capell A, Romig H, Grim M G, Lincoln S, Hardy J, Yu X, Picciano M, Fechteler K, et al. J Biol Chem. 1999;274:28669–28673. - PubMed
    1. Kimberly W T, Xia W, Rahmati T, Wolfe M S, Selkoe D J. J Biol Chem. 2000;275:3173–3178. - PubMed