

Bootstrapping cluster analysis: assessing the reliability of conclusions from microarray experiments
- PMID: 11470909
- PMCID: PMC55356
- DOI: 10.1073/pnas.161273698
Bootstrapping cluster analysis: assessing the reliability of conclusions from microarray experiments
Abstract
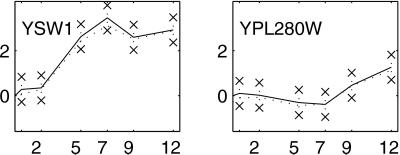
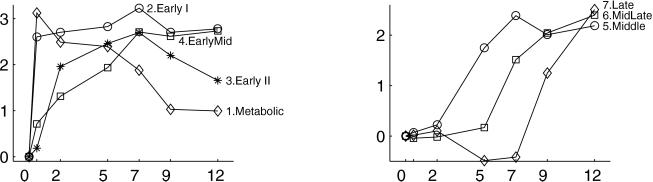
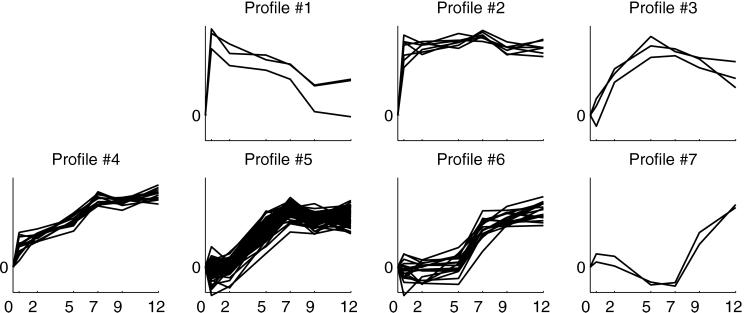
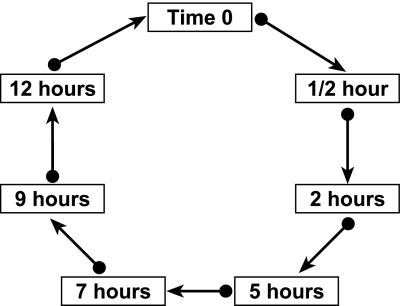
We introduce a general technique for making statistical inference from clustering tools applied to gene expression microarray data. The approach utilizes an analysis of variance model to achieve normalization and estimate differential expression of genes across multiple conditions. Statistical inference is based on the application of a randomization technique, bootstrapping. Bootstrapping has previously been used to obtain confidence intervals for estimates of differential expression for individual genes. Here we apply bootstrapping to assess the stability of results from a cluster analysis. We illustrate the technique with a publicly available data set and draw conclusions about the reliability of clustering results in light of variation in the data. The bootstrapping procedure relies on experimental replication. We discuss the implications of replication and good design in microarray experiments.
Figures
References
-
- Brown P O, Botstein D. Nat Genet Suppl. 1999;21:33–37. - PubMed
-
- Chu S, DeRisi J, Eisen M, Mulholland J, Botstein D, Brown P O. Science. 1998;282:699–705. - PubMed
-
- Hastie, T., Tibshirani, R., Eisen, M. B., Alizadeh, A., Levy, R., Staudt, L., Chan, W. C., Botstein, D. & Brown, P. (August 4, 2000) Genome Biol., http://genomebiology.com/2000/1/2/research/0003/. - PMC - PubMed
Publication types
MeSH terms
Grants and funding
LinkOut - more resources
Full Text Sources
Other Literature Sources
