. 2001 Aug;67(8):3683-92.
doi: 10.1128/AEM.67.8.3683-3692.2001.

Cluster structure of anaerobic aggregates of an expanded granular sludge bed reactor

Affiliations

Cluster structure of anaerobic aggregates of an expanded granular sludge bed reactor

G Gonzalez-Gil et al. Appl Environ Microbiol. 2001 Aug.

Abstract

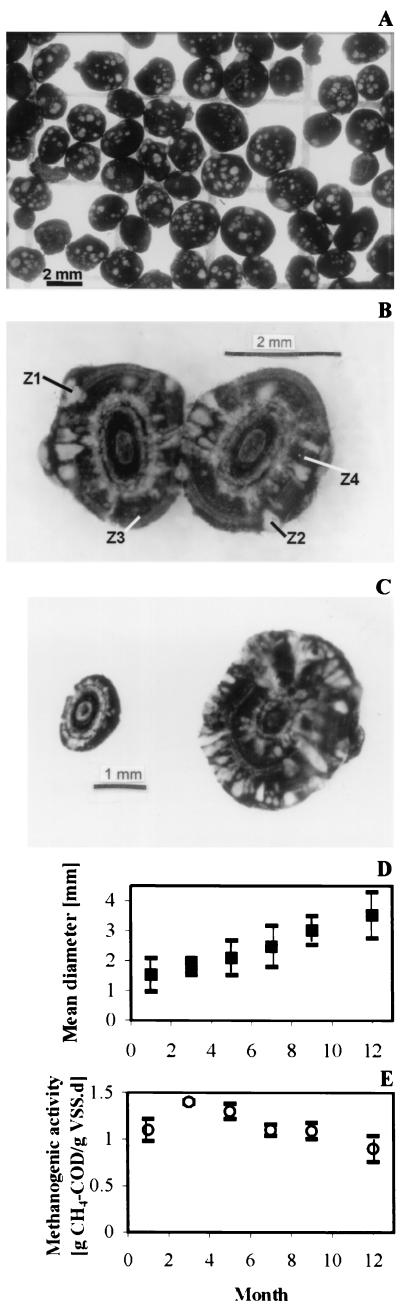
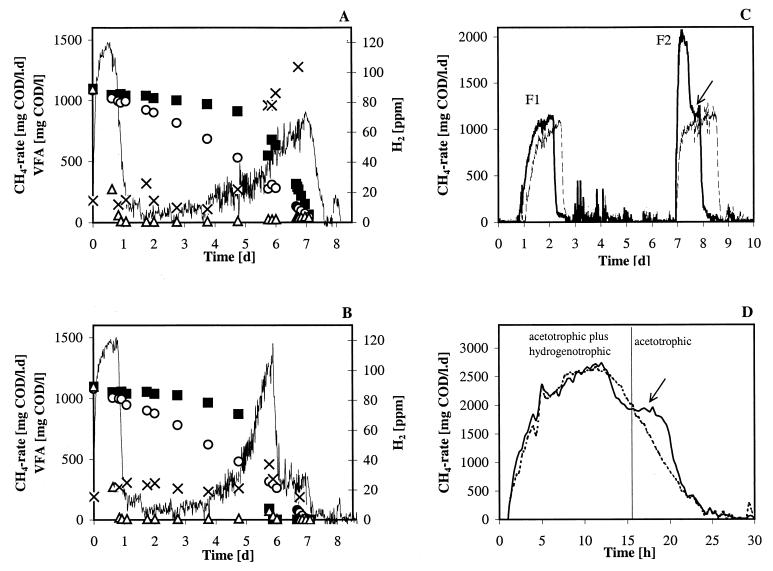
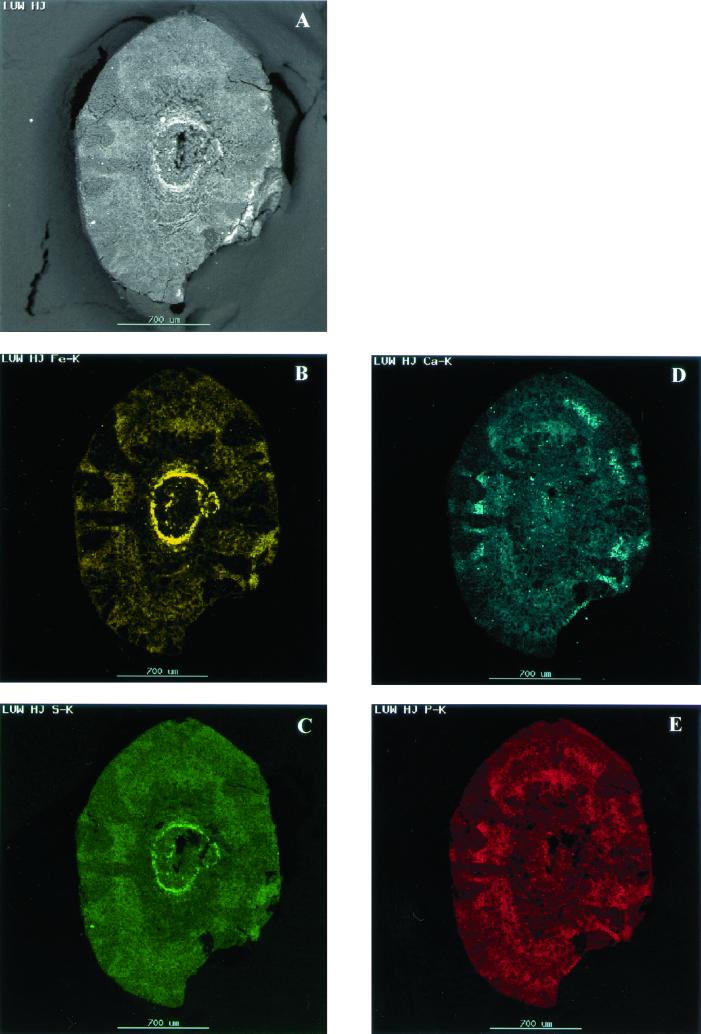
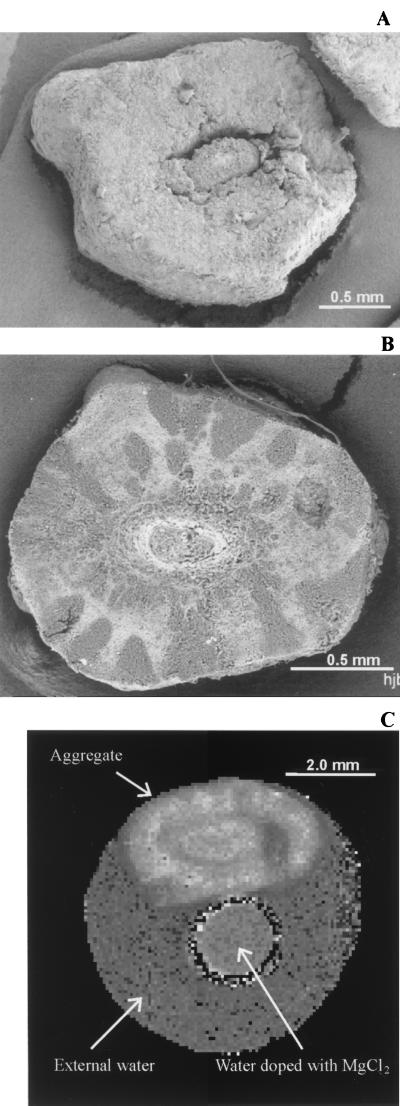
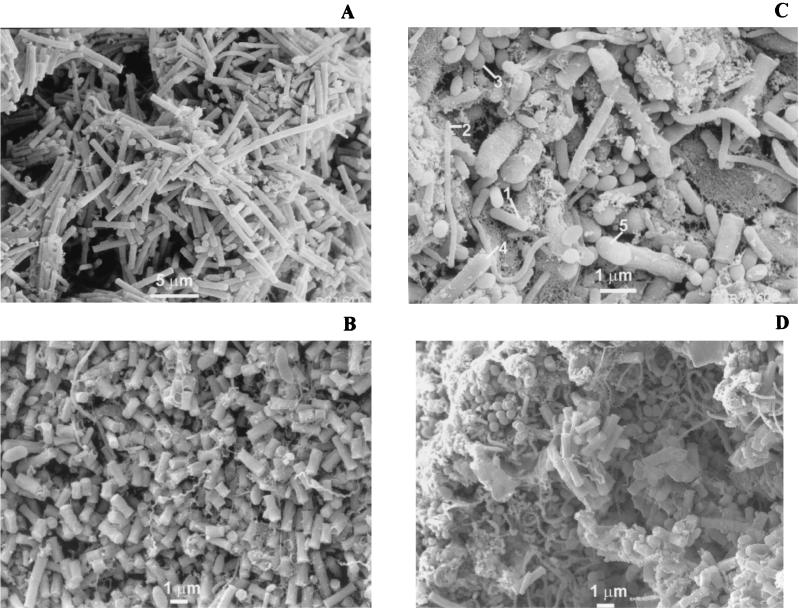
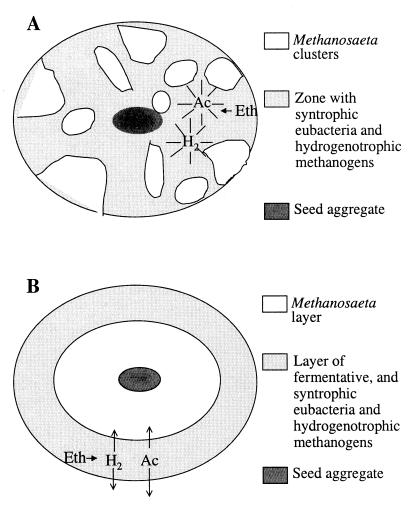
The metabolic properties and ultrastructure of mesophilic aggregates from a full-scale expanded granular sludge bed reactor treating brewery wastewater are described. The aggregates had a very high methanogenic activity on acetate (17.19 mmol of CH(4)/g of volatile suspended solids [VSS].day or 1.1 g of CH(4) chemical oxygen demand/g of VSS.day). Fluorescent in situ hybridization using 16S rRNA probes of crushed granules showed that 70 and 30% of the cells belonged to the archaebacterial and eubacterial domains, respectively. The spherical aggregates were black but contained numerous whitish spots on their surfaces. Cross-sectioning these aggregates revealed that the white spots appeared to be white clusters embedded in a black matrix. The white clusters were found to develop simultaneously with the increase in diameter. Energy-dispersed X-ray analysis and back-scattered electron microscopy showed that the whitish clusters contained mainly organic matter and no inorganic calcium precipitates. The white clusters had a higher density than the black matrix, as evidenced by the denser cell arrangement observed by high-magnification electron microscopy and the significantly higher effective diffusion coefficient determined by nuclear magnetic resonance imaging. High-magnification electron microscopy indicated a segregation of acetate-utilizing methanogens (Methanosaeta spp.) in the white clusters from syntrophic species and hydrogenotrophic methanogens (Methanobacterium-like and Methanospirillum-like organisms) in the black matrix. A number of physical and microbial ecology reasons for the observed structure are proposed, including the advantage of segregation for high-rate degradation of syntrophic substrates.


Figures

FIG. 1
FIG. 1
Morphology and sizes of the EGSB aggregates. (A) Overview of a sludge sample taken on the 5th month of reactor operation. (B) Cross section of an aggregate from the 7th month. Z1 to Z4, locations of microscopic observations presented in Fig. 5. (C) Comparison of granules from the start (left granule) and end (right granule) of the 1-year study period. (D) Development of the mean diameter of the granular sludge over the 1-year period. (E) Evolution of the specific methanogenic activity on acetate as a function of time.
FIG. 2
FIG. 2
Metabolic properties of the EGSB aggregates. (A and B) Methane production rates (lines) from a mixture of acetate (▵), propionate (○), and butyrate (▪) by granular sludge (A) and crushed granular sludge (B). ×, hydrogen. (C) Methane production rate of crushed aggregates. The first substrate feed (F1) consisted of ∼1,000 mg of acetate COD/liter, and the second substrate feed (F2) consisted of ∼1,500 mg of ethanol COD/liter added to one batch reactor (solid line) and ∼1,500 mg of acetate COD/liter added to a second batch reactor (dashed line). (D) Methane production rates from ethanol by intact (dashed line) and crushed (solid line) aggregates. Arrow (C and D), tailing on the methane production rate curve from the crushed biomass due to acetotrophic methanogenesis.
FIG. 3
FIG. 3
EDX analysis of a cross-sectioned aggregate. (A) Back-scattered electron image from which mappings of iron (B), sulfur (C), calcium (D), and phosphorus (E) were made. Note that the deposition of metals corresponds to the light areas observed in the back-scattered electron image.
FIG. 4
FIG. 4
(A) SEM image of a cross-sectioned aggregate. The oval structure at the center is most likely the original seed sludge. (B) Cross-sectioned aggregate observed with back-scattered SEM showing the cluster-like arrangement of the EGSB aggregate. Dark areas, regions with higher biomass concentrations; light areas, regions with high metal content. (C) Map of spin-spin relaxation rate R2 (= 1/T2) for a test tube containing a single (intact) EGSB aggregate immersed in demineralized water and a reference tube filled with MnCl2-doped demineralized water. Spatial resolution of the T2 map, 80 μm; slice thickness, 2 mm. White areas, regions with a high R2, i.e., slow relaxation rate. Note that R2 is the result of the physicochemical environments, i.e., pore size or polymer density (41).
FIG. 5
FIG. 5
SEM images taken from zones indicated in Fig. 1B. Images were obtained from cluster zones Z1 (A) and Z2 (B) and from areas between clusters Z3 (C) and Z4 (D). In the cluster zones mainly Methanosaeta-like microorganisms were observed, while in the areas between the clusters a more heterogeneous population was observed including methanogens, i.e., Methanobacterium-like (1), Methanospirillum-like (2), and Methanococcus-like (3) organisms, as well as syntrophs, a Pelobacter-like ethanol oxidizer (4), and a likely propionate oxidizer (5).
FIG. 6
FIG. 6
Schematic representation of the architecture of anaerobic aggregates. (A) Cluster-like arrangement; (B) layered arrangement. Note that in both cases acetate-utilizing Methanosaeta organisms segregate from the other microbiota. Ac, acetate; Eth, ethanol.

References

    1. American Public Health Association. Standard methods for examination of water and wastewater. 16th ed. Washington, D.C.: American Public Health Association; 1985.
    1. Colleran E, Concannon F, Golden T, Geoghegan F, Crumlish B, Killilea E, Henry M, Coates J. Use of methanogenic activity test to characterize anaerobic sludges, screen for anaerobic biodegradability and determine toxicity thresholds against individual anaerobic trophic groups and species. Water Sci Technol. 1992;25:31–40.
    1. Costerton J W, Lewandowski Z, De Beer D, Caldwell D, Korber D, James G. Biofilms, the customized microniche. J Bacteriol. 1994;176:2137–2142. - PMC - PubMed
    1. Davey M E, O'Toole G A. Microbial biofilms: from ecology to molecular genetics. Microbiol Mol Biol Rev. 2000;64:847–867. - PMC - PubMed
    1. Davies D G, Parsek M R, Pearson J P, Iglewski B H, Costerton J W, Greenberg E P. The involvement of cell-to-cell signals in the development of a bacterial biofilm. Science. 1998;280:295–298. - PubMed

Publication types

MeSH terms

LinkOut - more resources