. 2001 Aug;118(2):145-56.
doi: 10.1085/jgp.118.2.145.

A kinetic analysis of calcium-triggered exocytosis

Affiliations

A kinetic analysis of calcium-triggered exocytosis

P S Blank et al. J Gen Physiol. 2001 Aug.

Abstract

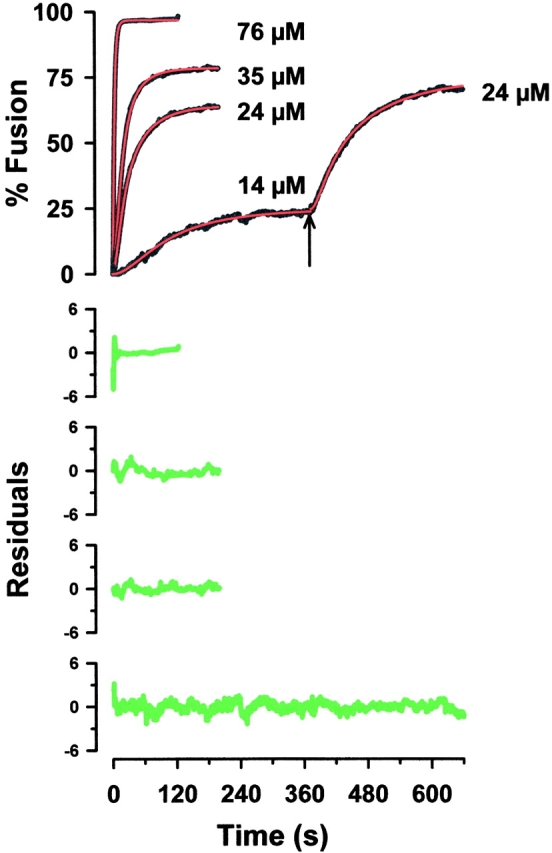
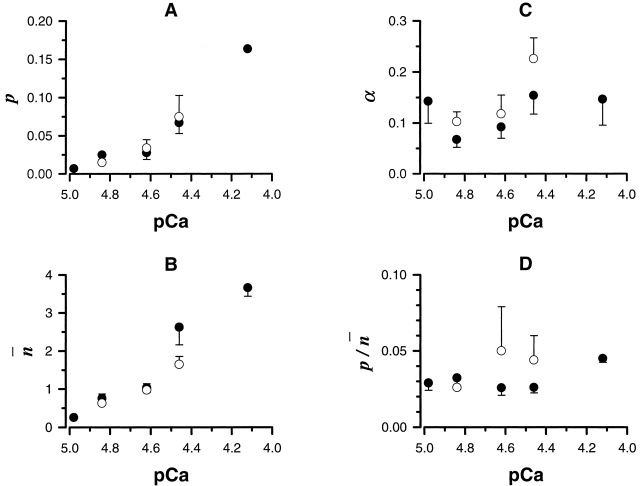
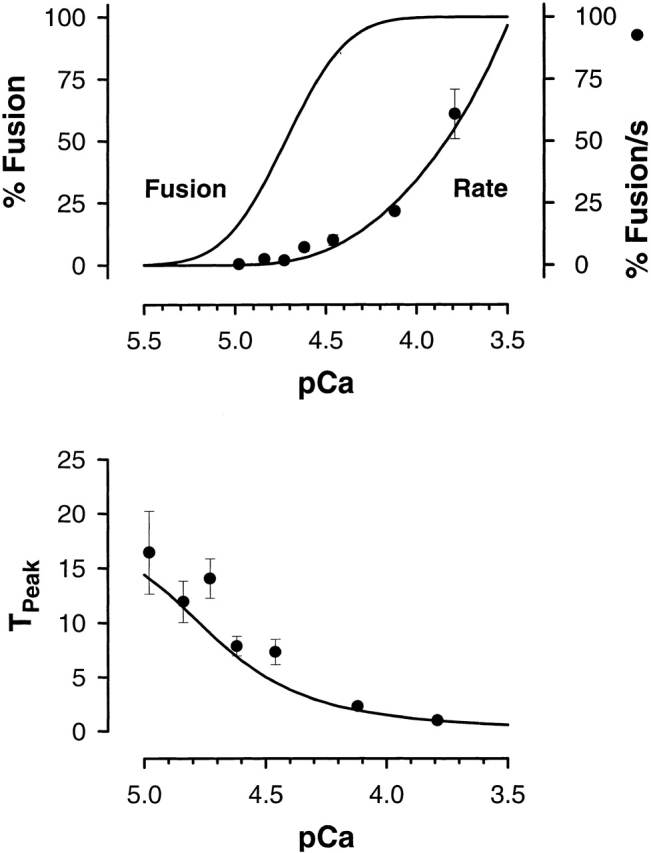
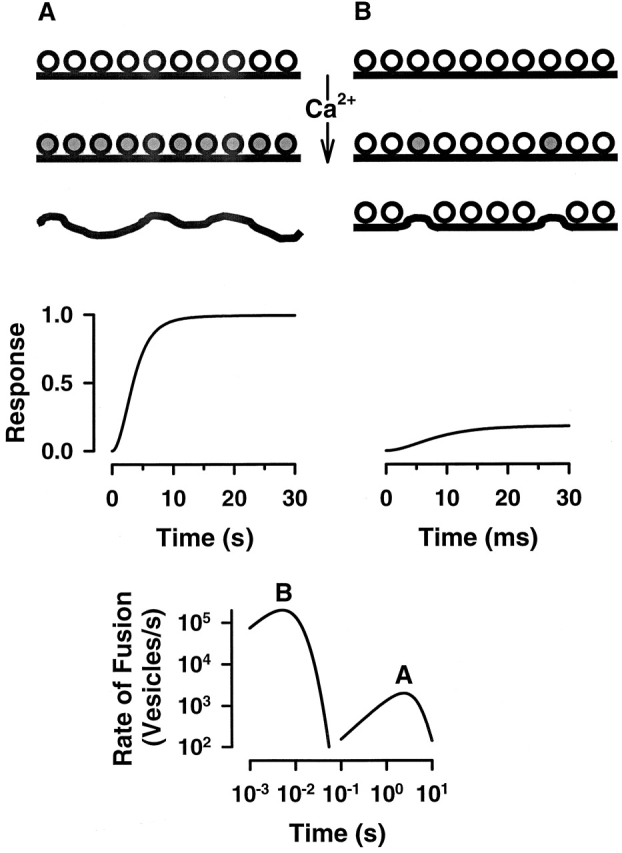
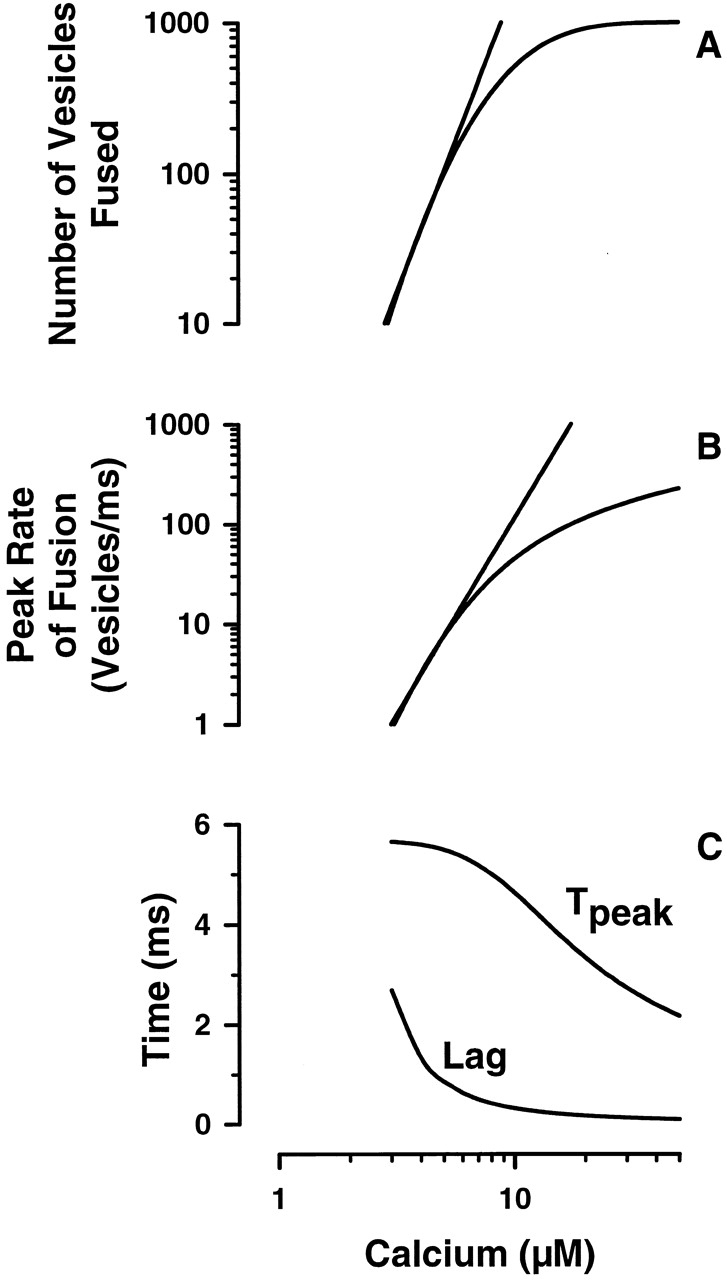
Although the relationship between exocytosis and calcium is fundamental both to synaptic and nonneuronal secretory function, analysis is problematic because of the temporal and spatial properties of calcium, and the fact that vesicle transport, priming, retrieval, and recycling are coupled. By analyzing the kinetics of sea urchin egg secretory vesicle exocytosis in vitro, the final steps of exocytosis are resolved. These steps are modeled as a three-state system: activated, committed, and fused, where interstate transitions are given by the probabilities that an active fusion complex commits (alpha) and that a committed fusion complex results in fusion, p. The number of committed complexes per vesicle docking site is Poisson distributed with mean n. Experimentally, p and n increase with increasing calcium, whereas alpha and the pn ratio remain constant, reducing the kinetic description to only one calcium-dependent, controlling variable, n. On average, the calcium dependence of the maximum rate (R(max)) and the time to reach R(max) (T(peak)) are described by the calcium dependence of n. Thus, the nonlinear relationship between the free calcium concentration and the rate of exocytosis can be explained solely by the calcium dependence of the distribution of fusion complexes at vesicle docking sites.


Figures

Figure 1
Figure 1
Typical fusion curves resulting from single and double challenge experiments at four different calcium concentrations are represented (14, 24, 35, and 76 μM). The data were collected using a sample time of 0.1 s The second fusion curve of a double challenge experiment was fit piecewise using a modification of the model. A fourth scaling parameter was used to represent the extent of fusion at the time of the second challenge. The data are black, the fitted curves are red, and the difference between the two (residuals) is green.
Figure 2
Figure 2
Dependence of p, n, α, and p n on calcium concentration (mean ± SEM; A–D). Open symbols represent the fitting results of double challenge experiments using the same final calcium concentration, as indicated by the matching closed symbols, of single challenge experiments.
Figure 3
Figure 3
The maximum fusion rate and the time to reach the maximum rate (TPeak) vary with calcium. Using the relationship between the extent of fusion (pCa and n), the experimentally derived constants for α, and the correlation between n and p, specifies the kinetic response as a function of calcium. The solid lines indicate these relationships, in agreement with the observed behavior of both the maximum rate and the time to reach the maximum rate.
Figure 4
Figure 4
A and B represent the calcium-triggered response in two systems showing egglike and neuronlike kinetic behaviors with parameters n = 5, τα = 10 s, and τP = 7 s, and n = 0.2, τα = 10 ms, and τP = 7 ms, respectively. The rates were calculated using a total releasable pool of 1,000 vesicles. Note, the kinetics of the neuronlike system is ∼100× faster than that of the egglike system.
Figure 5
Figure 5
A and B are the log-log representations for the calcium dependence of the extent and maximum fusion rate predicted for the neuronlike system with τα = 10 ms and τP = 7 ms. The n-calcium relationship was established using midpoint M = 10 μM and width W = 0.23 in the cumulative log-normal distribution. The straight lines are nth order fits to the linear portions of the curve (3–7 μM calcium); the extent and maximum rate are approximated by [Ca2+]4.0 and [Ca2+]3.9, respectively. C is the predicted calcium dependence for the time of the first fusion event (Lag) and the time to reach the maximum rate (Tpeak).

References

    1. Augustine G.J., Charlton M.P. Calcium dependence of presynaptic calcium current and post-synaptic response at the squid giant synapse. J. Physiol. 1986;381:619–640. - PMC - PubMed
    1. Augustine G.J., Neher E. Calcium requirements for secretion in bovine chromaffin cells. J. Physiol. 1992;450:247–271. - PMC - PubMed
    1. Augustine G.J., Charlton M.P., Smith S.J. Calcium entry and transmitter release at voltage-clamped nerve terminals of squid. J. Physiol. 1985;367:163–181. - PMC - PubMed
    1. Avery J., Hodel A., Whitaker M. In vitro exocytosis in sea urchin eggs requires a synaptobrevin-related protein. J. Cell Sci. 1997;110:1555–1561. - PubMed
    1. Bertram R., Sherman A., Stanley E.F. Single-domain/bound calcium hypothesis of transmitter release and facilitation. J. Neurophys. 1996;75:1919–1931. - PubMed

Publication types