. 2001 Aug;118(2):223-36.
doi: 10.1085/jgp.118.2.223.

The relative roles of passive surface forces and active ion transport in the modulation of airway surface liquid volume and composition

Affiliations

The relative roles of passive surface forces and active ion transport in the modulation of airway surface liquid volume and composition

R Tarran et al. J Gen Physiol. 2001 Aug.

Abstract

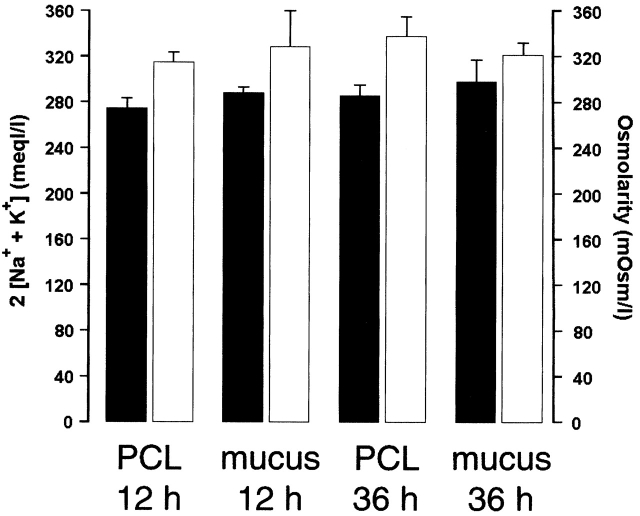
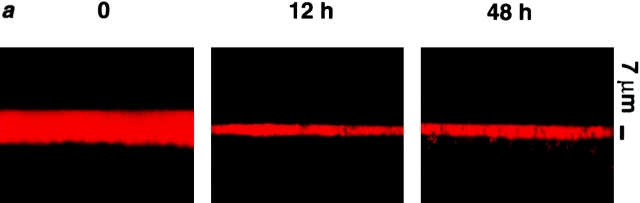
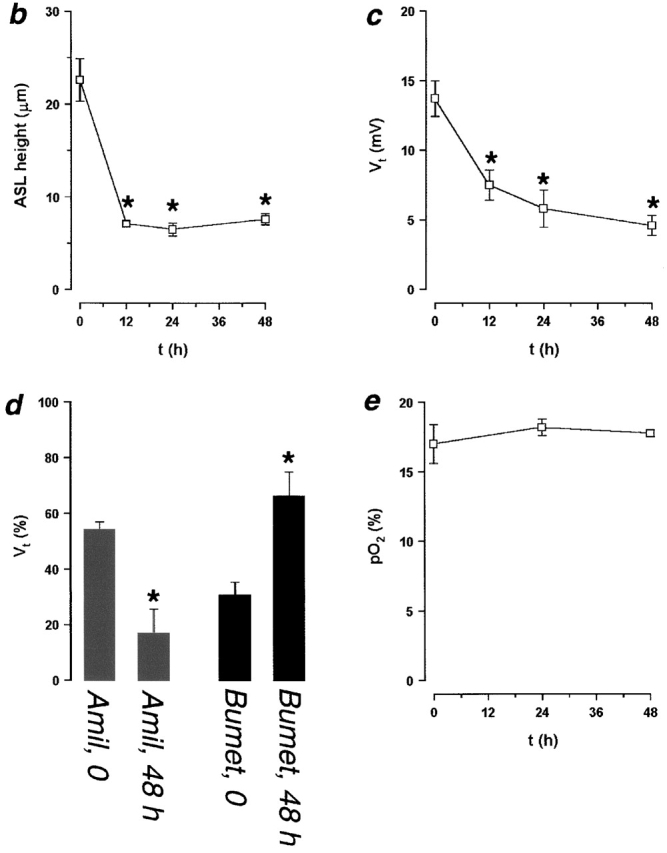
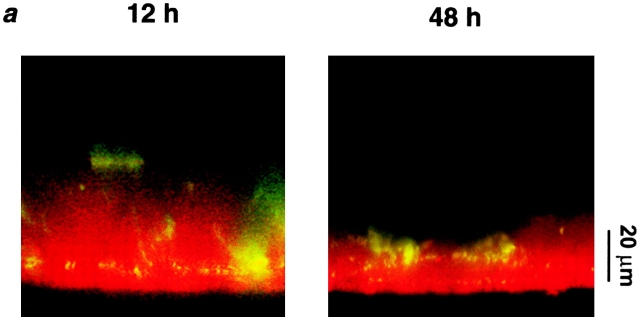
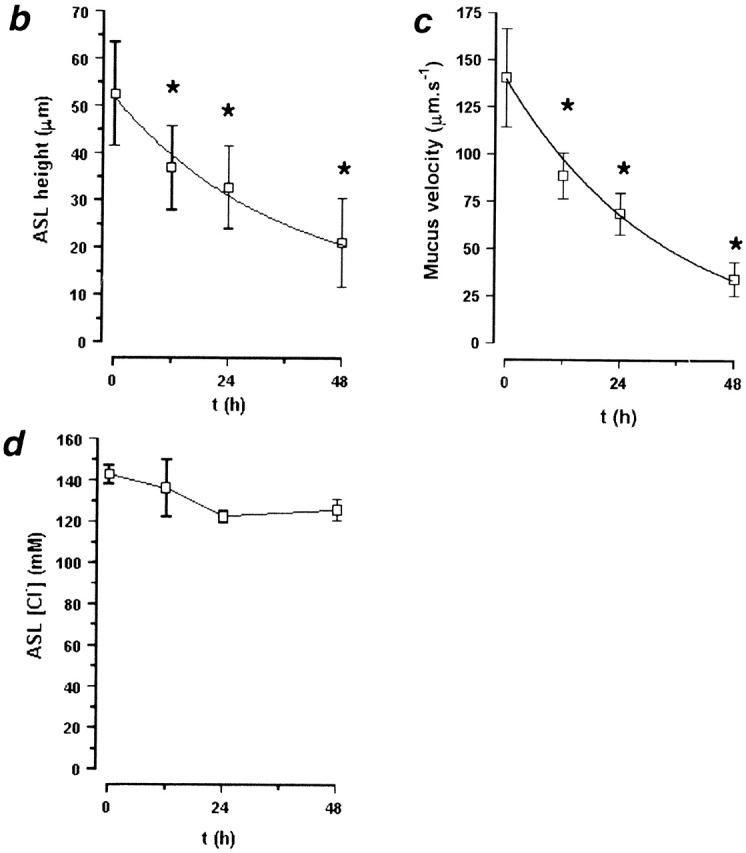
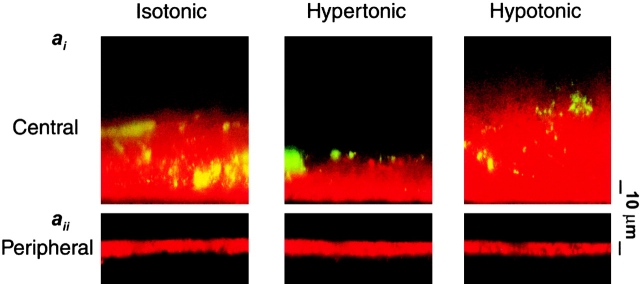
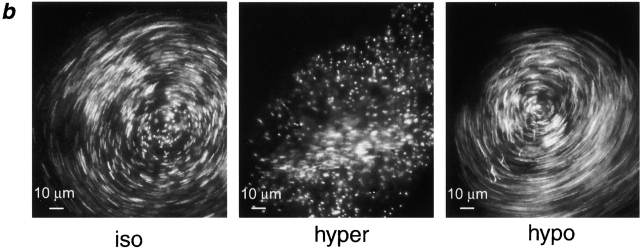
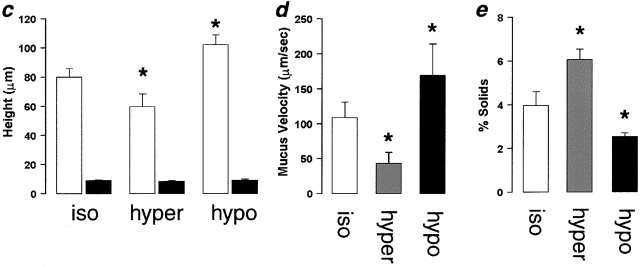
Two hypotheses have been proposed recently that offer different views on the role of airway surface liquid (ASL) in lung defense. The "compositional" hypothesis predicts that ASL [NaCl] is kept low (<50 mM) by passive forces to permit antimicrobial factors to act as a chemical defense. The "volume" hypothesis predicts that ASL volume (height) is regulated isotonically by active ion transport to maintain efficient mechanical mucus clearance as the primary form of lung defense. To compare these hypotheses, we searched for roles for: (1) passive forces (surface tension, ciliary tip capillarity, Donnan, and nonionic osmolytes) in the regulation of ASL composition; and (2) active ion transport in ASL volume regulation. In primary human tracheobronchial cultures, we found no evidence that a low [NaCl] ASL could be produced by passive forces, or that nonionic osmolytes contributed substantially to ASL osmolality. Instead, we found that active ion transport regulated ASL volume (height), and that feedback existed between the ASL and airway epithelia to govern the rate of ion transport and volume absorption. The mucus layer acted as a "reservoir" to buffer periciliary liquid layer height (7 microm) at a level optimal for mucus transport by donating or accepting liquid to or from the periciliary liquid layer, respectively. These data favor the active ion transport/volume model hypothesis to describe ASL physiology.


Figures

Figure 1
Figure 1
In vitro measurement of surface tension. (ai) Photomicrograph of a dimethylphthalate/octanol oil droplet suspended from a syringe above a culture. (aii) The same droplet deposited onto a culture. (bi and bii) Persistence of an electron-dense line at the air–liquid interface of OsO4/PFC-fixed cultures examined by TEM before and after washing with detergent (DTT). Bars: (a) 1 mm; (b) 0.6 μm.
Figure 2
Figure 2
Is ASL volume/composition determined by interactions between ASL/cilia or by the ASL salt mass? (a) Representative confocal images of ASL (red) after addition of 30 μl of either isotonic (300 mOsm) PBS or H2O. (b) Electron micrographs of airway epithelia fixed with OsO4/PFC 10 min after mucosal application of isotonic (300 mOsm) liquid or H2O, respectively. (c) Plots of average ASL height over time taken from a. Isotonic (circles); H2O (triangles), n = 5 and 6, respectively. (d) Plot of ASL height at steady state (10 min) after increases in serosal liquid tonicity from 300 to 1,500 mOsm (and after a return to 300 mOsm at the end of the experiment). (Squares, experimental data; n = 4; circles, predicted data from law of mass conservation.) Data shown as mean ± SEM. (*) Height significantly different from t = 0 (P < 0.05). (#) Height significantly different between groups (P < 0.05).
Figure 2
Figure 2
Is ASL volume/composition determined by interactions between ASL/cilia or by the ASL salt mass? (a) Representative confocal images of ASL (red) after addition of 30 μl of either isotonic (300 mOsm) PBS or H2O. (b) Electron micrographs of airway epithelia fixed with OsO4/PFC 10 min after mucosal application of isotonic (300 mOsm) liquid or H2O, respectively. (c) Plots of average ASL height over time taken from a. Isotonic (circles); H2O (triangles), n = 5 and 6, respectively. (d) Plot of ASL height at steady state (10 min) after increases in serosal liquid tonicity from 300 to 1,500 mOsm (and after a return to 300 mOsm at the end of the experiment). (Squares, experimental data; n = 4; circles, predicted data from law of mass conservation.) Data shown as mean ± SEM. (*) Height significantly different from t = 0 (P < 0.05). (#) Height significantly different between groups (P < 0.05).
Figure 3
Figure 3
Ionic composition of mucus layer and PCL: search for Donnan effects. (a) Electrolyte composition obtained by chemical analysis after microsampling of PCL and mucus supernatant (PCL, 12 h, n = 10; PCL, 36 h, n = 9; mucus layer, 12 h, n = 9; mucus layer, 36 h, n = 6). Black bars, PCL; white bars, mucus layer. (b) Impalement of ASL with double-barreled Cl-selective microelectrodes. The average height of the mucus was 120 ± 12 μm (n = 3). Epithelial impalement is shown as a sudden reduction in [Cl] that is followed by an increase in [Cl] once the microelectrode is returned to the ASL. (*) Data significantly different (P < 0.05) from ASL [Cl].
Figure 4
Figure 4
Analysis of osmolytes in ASL: comparison of the sum of 2([Na+] × [K+]) and osmolarity (PCL, 12 h, n = 10; PCL, 36 h, n = 9; mucus layer, 12 h, n = 9; mucus layer, 36 h, n = 8). Black bars, 2 [Na+ + K+]; white bars, osmolarity. At 12 h, [Na+] was (in mM) 136.3 ± 4.1 and 140.6 ± 5.1 in mucus and PCL, respectively; and [K+] was (in mM) 1.1 ± 0.2 and 2.1 ± 0.4 in mucus and PCL, respectively. At 36 h, [Na+] was (in mM) 133.4 ± 8.9 and 145.5 ± 8.9 in mucus and PCL, respectively; and [K+] was 1.8 ± 0.4 and 4.0 ± 0.6 (in mM) in mucus and PCL, respectively. Data shown as mean ± SEM.
Figure 5
Figure 5
ASL absorption (height) and epithelial bioelectric properties with time. (a) Representative confocal images of ASL (red) 0, 12, and 48 h after mucosal addition of 20 μl PBS. (b and c) Plots of ASL height and transepithelial electric potential difference (Vt), respectively, over 48 h (n = 8). (d) Bar graph depicting percent changes in amiloride- and bumetanide-sensitive Vt immediately before PBS volume addition and 48 h afterwards. (e) Plot of ASL PO2 over 48 h (n = 4). (*) Data significantly different (P < 0.05) from t = 0. Data shown as mean ± SEM.
Figure 5
Figure 5
ASL absorption (height) and epithelial bioelectric properties with time. (a) Representative confocal images of ASL (red) 0, 12, and 48 h after mucosal addition of 20 μl PBS. (b and c) Plots of ASL height and transepithelial electric potential difference (Vt), respectively, over 48 h (n = 8). (d) Bar graph depicting percent changes in amiloride- and bumetanide-sensitive Vt immediately before PBS volume addition and 48 h afterwards. (e) Plot of ASL PO2 over 48 h (n = 4). (*) Data significantly different (P < 0.05) from t = 0. Data shown as mean ± SEM.
Figure 6
Figure 6
Active ion transport can modify ASL height over time in the presence of a mucus layer. (a) Representative confocal images of ASL (red) and mucus (green beads) 12 and 48 h after addition of 50 μl PBS. (b–d) Plots of ASL height, ASL [Cl], and mucus velocity, respectively, over time (n = 6). (*) Data significantly different (P < 0.05) from t = 0. Data shown as mean ± SEM.
Figure 6
Figure 6
Active ion transport can modify ASL height over time in the presence of a mucus layer. (a) Representative confocal images of ASL (red) and mucus (green beads) 12 and 48 h after addition of 50 μl PBS. (b–d) Plots of ASL height, ASL [Cl], and mucus velocity, respectively, over time (n = 6). (*) Data significantly different (P < 0.05) from t = 0. Data shown as mean ± SEM.
Figure 7
Figure 7
Mucus as a liquid reservoir. (a) Representative confocal images of ASL (red) and green fluorescent beads (which discontinually associate with mucus) after anisotonic media changes in the basolateral bath. (ai) Central, mucus-containing regions. (aii) Peripheral regions without mucus (bead-free). Basolateral bath conditions: isotonic (300 mOsm); hypertonic (600 mOsm); hypotonic (200 mOsm). (b) Photographs of rotational mucus transport after basolateral media changes, as indicated by 5-s exposure streaks of fluorescent microsphere movements. (c) Mean data from protocols shown in a (n = 5). White bars, mucus-containing regions; black bars, regions without mucus. (d) Mean data from b of mucus velocities obtained 1 mm from the center of rotation after serosal media changes. iso (white bars); hyper (gray bars); hypo (black bars); all n = 5. (e) Percent solids obtained from wet/dry ratios of mucus samples from airway cultures after serosal media changes. iso, n = 5 (white bars); hyper, n = 8 (gray bars); hypo, n = 8 (black bars). (*) Data significantly different (P < 0.05) from isotonic values. Data shown as mean ± SEM.
Figure 7
Figure 7
Mucus as a liquid reservoir. (a) Representative confocal images of ASL (red) and green fluorescent beads (which discontinually associate with mucus) after anisotonic media changes in the basolateral bath. (ai) Central, mucus-containing regions. (aii) Peripheral regions without mucus (bead-free). Basolateral bath conditions: isotonic (300 mOsm); hypertonic (600 mOsm); hypotonic (200 mOsm). (b) Photographs of rotational mucus transport after basolateral media changes, as indicated by 5-s exposure streaks of fluorescent microsphere movements. (c) Mean data from protocols shown in a (n = 5). White bars, mucus-containing regions; black bars, regions without mucus. (d) Mean data from b of mucus velocities obtained 1 mm from the center of rotation after serosal media changes. iso (white bars); hyper (gray bars); hypo (black bars); all n = 5. (e) Percent solids obtained from wet/dry ratios of mucus samples from airway cultures after serosal media changes. iso, n = 5 (white bars); hyper, n = 8 (gray bars); hypo, n = 8 (black bars). (*) Data significantly different (P < 0.05) from isotonic values. Data shown as mean ± SEM.

References

    1. Bansil R., Stanley E., LaMont J.T. Mucin biophysics. Annu. Rev. Physiol. 1995;57:635–657. - PubMed
    1. Boucher R.C. Molecular insights into the physiology of the ‘thin film’ of airway surface liquid. J. Physiol. 1999;516:631–638. - PMC - PubMed
    1. Carson J.L., Collier A.M., Knowles M.R., Boucher R.C., Rose J.G. Morphometric aspects of ciliary distribution and ciliogenesis in human nasal epithelium. Proc. Natl. Acad. Sci. USA. 1981;78:6996–6999. - PMC - PubMed
    1. Davril M., Degroote S., Humbert P., Galabert C., Dumur V., Lafitte J.J., Lamblin G., Roussel P. The sialylation of bronchial mucins secreted by patients suffering from cystic fibrosis or from chronic bronchitis is related to the severity of airway infection. Glycobiology. 1999;9:311–321. - PubMed
    1. Goldman M.J., Anderson G.M., Stolzenberg E.D., Kari U.P., Zasloff M., Wilson J.M. Human beta-defensin-1 is a salt-sensitive antibiotic that is inactivated in cystic fibrosis. Cell. 1997;88:553–560. - PubMed

Publication types