. 2001 Jul 31;98(16):9300-5.
doi: 10.1073/pnas.161091198.

Imaging transcriptional regulation of p53-dependent genes with positron emission tomography in vivo

Affiliations

Imaging transcriptional regulation of p53-dependent genes with positron emission tomography in vivo

M Doubrovin et al. Proc Natl Acad Sci U S A. .

Abstract

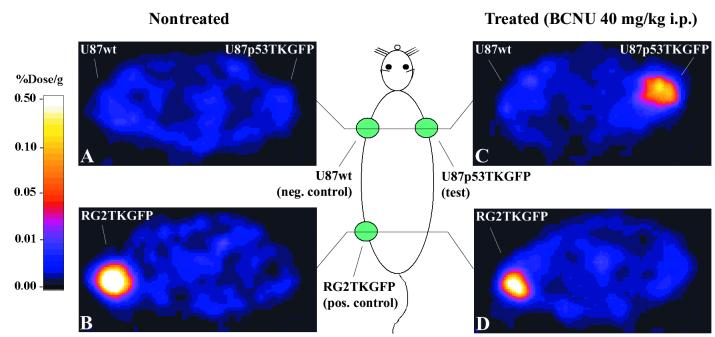
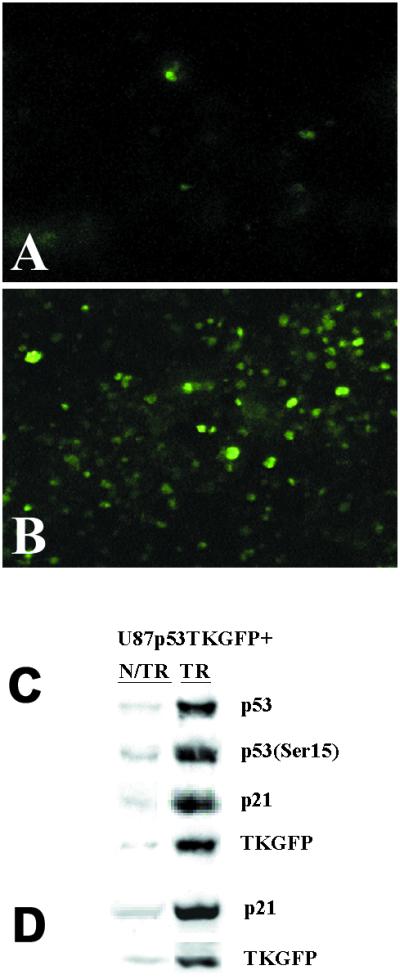
A noninvasive method for molecular imaging of the activity of different signal transduction pathways and the expression of different genes in vivo would be of considerable value. It would aid in understanding the role specific genes and signal transduction pathways have in various diseases, and could elucidate temporal dynamics and regulation at different stages of disease and during various therapeutic interventions. We developed and assessed a method for monitoring the transcriptional activation of endogenous genes by positron-emission tomography (PET) imaging. The HSV1-tk/GFP (TKGFP) dual reporter gene was used to monitor transcriptional activation of p53-dependent genes. A retrovirus bearing the Cis-p53/TKGFP reporter system was constructed in which the TKGFP reporter gene was placed under control of an artificial cis-acting p53-specific enhancer. U87 glioma and SaOS-2 osteosarcoma cells were transduced with this retrovirus and used to establish xenografts in rats. We demonstrated that DNA damage-induced up-regulation of p53 transcriptional activity correlated with the expression of p53-dependent downstream genes, such as p21, in U87 (wild-type p53), but not in SaOS-2 osteosarcoma (p53 -/-) cells. We showed that PET, with [(124)I]FIAU (2'-fluoro-2'-deoxy-1-beta-d-arabinofuranosyl-5-[(124)I]iodouracil) and the Cis-p53TKGFP reporter system, is sufficiently sensitive to image the transcriptional regulation of genes in the p53 signal transduction pathway. These imaging results were confirmed by independent measurements of p53 activity and the expression levels of downstream genes (e.g., p21) by using conventional molecular-biological assays. PET imaging of p53 transcriptional activity in tumor xenografts by using the Cis-p53TKGFP reporter system may be useful in assessing novel therapeutic approaches.


Figures

Figure 1
Figure 1
Validation of Cis-p53/TKGFP reporter system in cell cultures. (A) Structure of the DXS53TGN retroviral vector bearing the Cis-p53/TKGFP reporter system. This vector has a mutation in the 3′LTR that renders the silencing of its promoter activity after duplication as 5′LTR during integration. The expression of the TKGFP gene is regulated by an artificial promoter containing multiple tandem repeats of a p53-specific DNA-binding motif. Constitutive expression of the neomycin-resistance gene (Neo) is driven by the simian virus 40 early immediate promoter, allowing for the selection of stably transduced cells. Fluorescence microscopy and fluorescence-activated cell sorting (FACS) analysis of a transduced U87p53/TKGFP cell population in the noninduced (control) state (B and C), and 24 h after a 2-h treatment with N,N′-bis(2-chloroethyl)-N-nitrosourea (BCNU) at 40 μg/ml (D and E). (F) Immunoblot analysis for total p53, activated p53 (Ser15 phosphorylated), p21, and TKGFP protein levels in U87p53/TKGFP cells in the noninduced state (0) and after treatment with different doses of etoposide (5–40 μg/ml), 40 μg/ml BCNU, or 400 mJ of UV radiation. (G) Reverse transcription (RT)-PCR analysis for p21 and TKGFP mRNA levels performed in the same samples as shown in F. The levels of phospho-p53, total p53, p21, and TKGFP proteins increase after etoposide treatment in a dose-dependent manner; similar increases were observed for BCNU and UV treatments (data not shown). (H) TKGFP expression in different cell populations as measured by the radiotracer assay. The FIAU/thymidine (TdR) ratio is low in wild-type U87 cells (negative control) and in noninduced U87p53/TKGFP cells. In contrast, BCNU-treated U87p53/TKGFP cells had a significantly higher FIAU/TdR accumulation ratio (higher TKGFP expression), which was within the range observed in RG2TKGFP cells that constitutively express TKGFP.
Figure 2
Figure 2
PET imaging of endogenous p53 activation. Transaxial PET images through the shoulder (A and C) and pelvis (B and D) of two rats are shown; the images are color-coded to the same radioactivity scale (% dose/g). A nontreated animal is shown on the left, and a BCNU-treated animal is shown on the right. Both animals had three s.c. tumor xenografts: U87p53TKGFP (test) in the right shoulder, U87 wild-type (negative control) in the left shoulder, and RG2TKGFP (positive control) in the left thigh. The nontreated animal on the left shows localization of radioactivity only in the positive control tumor (RG2TKGFP); the test (U87p53TKGFP) and negative control (U87wt) tumors are at background levels. The BCNU-treated animal on the right shows significant radioactivity localization in the test tumor (right shoulder) and in the positive control (left thigh), but no radioactivity above background in the negative control (left shoulder).
Figure 3
Figure 3
Tissue radioactivity and tissue-to-muscle ratios. Two groups of animals are compared; nontreated (solid bars, n = 6) and BCNU-treated (40 mg/kg, i.p., shaded bars, n = 6). Tissue radioactivity (% dose/g; A) and the tissue-to-muscle radioactivity ratio (B) are shown; error bars are ± SD. Significant differences between BCNU-treated and nontreated animals (unpaired t test, P < 0.05) are indicated by *. Significant differences between the test (U87p53TKGFP) and negative control (U87wt) xenografts (paired t test, P < 0.05), in either BCNU-treated or nontreated animals, is indicated by †.
Figure 4
Figure 4
Assessment of Cis-p53/TKGFP reporter system in U87p53/TKGFP s.c. tumor tissue samples. Fluorescence microscopy images of U87p53/TKGFP s.c. tumor samples obtained from nontreated rats (A) and rats treated with 40 mg/kg BCNU i.p. (B). The same U87p53/TKGFP s.c. tumor samples obtained from nontreated (N/TR) and BCNU-treated (TR) animals were assessed for the levels of activated p53 (Ser-15 phosphorylated), total p53 protein, p21, and TKGFP proteins by immunoblot analysis (C); and for the levels of p21 and TKGFP mRNAs by RT-PCR (D).

References

    1. Tjuvajev J G, Stockhammer G, Desai R, Uehara H, Watanabe K, Gansbacher B, Blasberg R. Cancer Res. 1995;55:6126–6132. - PubMed
    1. Tjuvajev J G, Finn R, Watanabe K, Joshi R, Oku T, Kennedy J, Beattie B, Koutcher J, Larson S, Blasberg R. Cancer Res. 1996;56:4087–4095. - PubMed
    1. Tjuvajev J G, Chen S H, Joshi A, Joshi R, Guo Z S, Balatoni J, Ballon D, Koutcher J, Finn R, Woo S L, Blasberg R G. Cancer Res. 1999;59:5186–5193. - PubMed
    1. Tjuvajev J G, Joshi A, Callegari J, Lindsley L, Joshi R, Balatoni J, Finn R, Larson S, Sadelain M, Blasberg R. Neoplasia. 1999;1:315–320. - PMC - PubMed
    1. Tjuvajev J G, Avril N, Oku T, Sasajima T, Miyagava T, Joshi R, Safer M, Beattie B, DiResta G, Daghighian F, et al. Cancer Res. 1998;58:4333–4341. - PubMed

Publication types