Paternal population history of East Asia: sources, patterns, and microevolutionary processes
- PMID: 11481588
- PMCID: PMC1235490
- DOI: 10.1086/323299
Paternal population history of East Asia: sources, patterns, and microevolutionary processes
Abstract
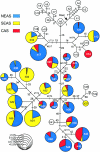
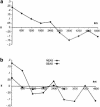
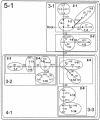
Asia has served as a focal point for human migration during much of the Late Pleistocene and Holocene. Clarification of East Asia's role as a source and/or transit point for human dispersals requires that this region's own settlement history be understood. To this end, we examined variation at 52 polymorphic sites on the nonrecombining portion of the Y chromosome (NRY) in 1,383 unrelated males, representing 25 populations from southern East Asia (SEAS), northern East Asia (NEAS), and central Asia (CAS). The polymorphisms defined 45 global haplogroups, 28 of which were present in these three regions. Although heterozygosity levels were similar in all three regions, the average pairwise difference among haplogroups was noticeably smaller in SEAS. Multidimensional scaling analysis indicated a general separation of SEAS versus NEAS and CAS populations, and analysis of molecular variance produced very different values of Phi(ST) in NEAS and SEAS populations. In spatial autocorrelation analyses, the overall correlogram exhibited a clinal pattern; however, the NEAS populations showed evidence of both isolation by distance and ancient clines, whereas there was no evidence of structure in SEAS populations. Nested cladistic analysis demonstrated that population history events and ongoing demographic processes both contributed to the contrasting patterns of NRY variation in NEAS and SEAS. We conclude that the peopling of East Asia was more complex than earlier models had proposed-that is, a multilayered, multidirectional, and multidisciplinary framework is necessary. For instance, in addition to the previously recognized genetic and dental dispersal signals from SEAS to NEAS populations, CAS has made a significant contribution to the contemporary gene pool of NEAS, and the Sino-Tibetan expansion has left traces of a genetic trail from northern to southern China.
Figures


References
Electronic-Database Information
-
- GeoDis Home Page, http://bioag.byu.edu/zoology/crandall_lab/geodis.htm (for GeoDis version 2.0 software)
References
-
- Ammerman AJ, Cavalli-Sforza LL (1984) Neolithic transition and the genetics of populations in Europe. Princeton University Press, Princeton
-
- Barbujani G (2000) Geographic patterns: how to identify them and why. Hum Biol 72:133–153 - PubMed
-
- Barbujani G, Pilastro A, De Domenico S, Renfrew C (1994) Genetic variation in North Africa and Eurasia: Neolithic demic diffusion vs. Paleolithic colonisation. Am J Phys Anthropol 95:137–154 - PubMed
Publication types
MeSH terms
Grants and funding
LinkOut - more resources
Full Text Sources

