Histaminergic modulation of GABAergic transmission in rat ventromedial hypothalamic neurones
- PMID: 11483709
- PMCID: PMC2278729
- DOI: 10.1111/j.1469-7793.2001.00791.x
Histaminergic modulation of GABAergic transmission in rat ventromedial hypothalamic neurones
Abstract
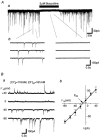
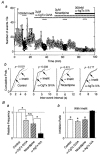
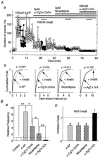
1. The ventromedial nucleus of the hypothalamus (VMH) is a key nucleus in the homeostatic regulation of neuroendocrine and behavioural functions. In mechanically dissociated rat VMH neurones with attached native presynaptic nerve endings, GABAergic spontaneous inhibitory postsynaptic currents (sIPSCs) were recorded using the nystatin perforated patch recording mode under voltage-clamp conditions. 2. Histamine reversibly inhibited the sIPSC frequency in a concentration-dependent manner without affecting the mean current amplitude. The selective histamine receptor type 3 (H(3)) agonist imetit (100 nM) mimicked this effect and it was completely abolished by the selective H(3) receptor antagonists clobenpropit (3 microM) and thioperamide (10 microM). 3. The GTP-binding protein inhibitor N-ethylmaleimide (10 microM) removed the histaminergic inhibition of GABAergic sIPSCs. 4. Elimination of external Ca(2+) reduced the GABAergic sIPSC frequency without affecting the distribution of current amplitudes. In this condition, the inhibitory effect of imetit on the sIPSC frequency completely disappeared, suggesting that the histaminergic inhibition requires extracellular Ca(2+). 5. The P/Q-type Ca(2+) channel blocker omega-agatoxin IVA (300 nM) attenuated the histaminergic inhibition of the GABAergic sIPSC frequency, but neither the N-type Ca(2+) channel blocker omega-conotoxin GVIA (3 microM) nor the L-type Ca(2+) channel blocker nicardipine (3 microM) was effective. 6. Activation of adenylyl cyclase with forskolin (10 microM) had no effect on histaminergic inhibition of the sIPSCs. 7. In conclusion, histamine inhibits spontaneous GABA release from presynaptic nerve terminals projecting to VMH neurones by inhibiting presynaptic P/Q-type Ca(2+) channels via a G-protein coupled to H(3) receptors and this may modulate the excitability of VMH neurones.
Figures


Similar articles
-
Adenosine A1 receptors inhibit GABAergic transmission in rat tuberomammillary nucleus neurons.J Neurochem. 2008 Jul;106(1):361-71. doi: 10.1111/j.1471-4159.2008.05400.x. Epub 2008 Jul 1. J Neurochem. 2008. PMID: 18397365
-
Adenosine A1 receptor-mediated presynaptic inhibition of GABAergic transmission in immature rat hippocampal CA1 neurons.J Neurophysiol. 2003 Mar;89(3):1214-22. doi: 10.1152/jn.00516.2002. J Neurophysiol. 2003. PMID: 12626609
-
beta(2)-Adrenoceptor-mediated facilitation of glutamatergic transmission in rat ventromedial hypothalamic neurons.Neuroscience. 2007 Feb 23;144(4):1255-65. doi: 10.1016/j.neuroscience.2006.10.049. Epub 2006 Dec 18. Neuroscience. 2007. PMID: 17175110
-
Histamine receptor and its regulation of energy metabolism.Obes Res. 1995 Nov;3 Suppl 4:541S-548S. doi: 10.1002/j.1550-8528.1995.tb00225.x. Obes Res. 1995. PMID: 8697056 Review.
-
Ovarian hormone action in the hypothalamic ventromedial nucleus: remodelling to regulate reproduction.J Neuroendocrinol. 2011 Jun;23(6):465-71. doi: 10.1111/j.1365-2826.2011.02143.x. J Neuroendocrinol. 2011. PMID: 21518031 Free PMC article. Review.
Cited by
-
Inhibition of Astrocytic Histamine N-Methyltransferase as a Possible Target for the Treatment of Alzheimer's Disease.Biomolecules. 2021 Sep 26;11(10):1408. doi: 10.3390/biom11101408. Biomolecules. 2021. PMID: 34680041 Free PMC article. Review.
-
International Union of Basic and Clinical Pharmacology. XCVIII. Histamine Receptors.Pharmacol Rev. 2015 Jul;67(3):601-55. doi: 10.1124/pr.114.010249. Pharmacol Rev. 2015. PMID: 26084539 Free PMC article. Review.
-
Histaminergic regulation of food intake.Front Endocrinol (Lausanne). 2023 Jun 27;14:1202089. doi: 10.3389/fendo.2023.1202089. eCollection 2023. Front Endocrinol (Lausanne). 2023. PMID: 37448468 Free PMC article. Review.
-
Plasticity of the histamine H3 receptors after acute vestibular lesion in the adult cat.Front Integr Neurosci. 2014 Jan 3;7:87. doi: 10.3389/fnint.2013.00087. eCollection 2014. Front Integr Neurosci. 2014. PMID: 24427120 Free PMC article.
-
Histamine facilitates GABAergic transmission in the rat entorhinal cortex: Roles of H1 and H2 receptors, Na+ -permeable cation channels, and inward rectifier K+ channels.Hippocampus. 2017 May;27(5):613-631. doi: 10.1002/hipo.22718. Epub 2017 Feb 28. Hippocampus. 2017. PMID: 28188663 Free PMC article.
References
-
- Akaike N, Harata N. Nystatin perforated patch recording and its application to analysis of intracellular mechanism. Japanese Journal of Physiology. 1994;44:433–473. - PubMed
-
- Ankri N, Legendre P, Faber DS, Korn H. Automatic detection of spontaneous synaptic responses in central neurons. Journal of Neuroscience Methods. 1994;52:87–100. - PubMed
-
- Arrang JM. Pharmacological properties of histamine receptor subtypes. Cellular and Molecular Biology. 1994;40:273–279. - PubMed
-
- Arrang JM, Garbarg M, Schwartz JC. Auto-inhibition of brain histamine release mediated by a novel class (H3) of histamine receptor. Nature. 1983;302:832–837. - PubMed
-
- Arrang JM, Garbarg M, Schwartz JC. Autoregulation of histamine release in brain by presynaptic H3-receptors. Neuroscience. 1985;15:553–562. - PubMed
Publication types
MeSH terms
Substances
LinkOut - more resources
Full Text Sources
Miscellaneous

