

Review
doi: 10.1038/35086012.
Correlated neuronal activity and the flow of neural information
Affiliations
- PMID: 11483997
- PMCID: PMC2868968
- DOI: 10.1038/35086012
Item in Clipboard
Review
Correlated neuronal activity and the flow of neural information
Nat Rev Neurosci.
2001 Aug.
Abstract
For years we have known that cortical neurons collectively have synchronous or oscillatory patterns of activity, the frequencies and temporal dynamics of which are associated with distinct behavioural states. Although the function of these oscillations has remained obscure, recent experimental and theoretical results indicate that correlated fluctuations might be important for cortical processes, such as attention, that control the flow of information in the brain.
Figures
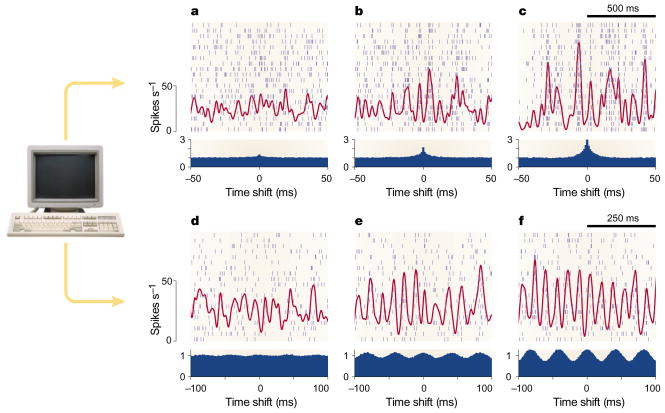
Each panel includes a raster plot with 20 simulated spike trains generated simultaneously; each row corresponds to one artificial neuron and each small vertical line to a spike. All neurons were set to fire at a mean rate of 27 spikes s−1 and with a CVISI near 1, as for a Poisson process (the CVISI is equal to the standard deviation of the interspike intervals divided by their mean). Red traces show instantaneous firing rate or spike density, obtained by smoothing the spike traces with a Gaussian function (σ = 10 ms for top row; σ = 5 ms for bottom row) and averaging across neurons. Blue histograms show the average cross-correlation between all possible distinct pairs of units. Cross-correlograms were computed from 20-s segments of simulated data, which included the short segments shown. The y axes are proportional to the probability that two spikes from two different neurons are separated in time by the amount indicated in the x axis. The normalization is such that the probability expected by chance, assuming independence, is set to 1. a–c| Each neuron was driven by 1,000 random inputs and, on average, individual pairs of neurons shared 10% (a), 25% (b) or 50% (c) of those inputs. As the fraction of shared inputs rises, neurons tend to fire closer together in time, which produces larger fluctuations in the average spike density. d–f| Here, the neurons fired through independent Poisson processes, but the underlying firing rate was equal to 27(1 + Asin(2π25t)), where t is the time in seconds, and was identical for all units. So, the mean rate was still 27 spikes s−1, but it oscillated with a frequency of 25 Hz. The amplitude of the oscillations was A = 0.25 (d), A = 0.50 (e) or A = 0.75 (f). See REF. for further details.
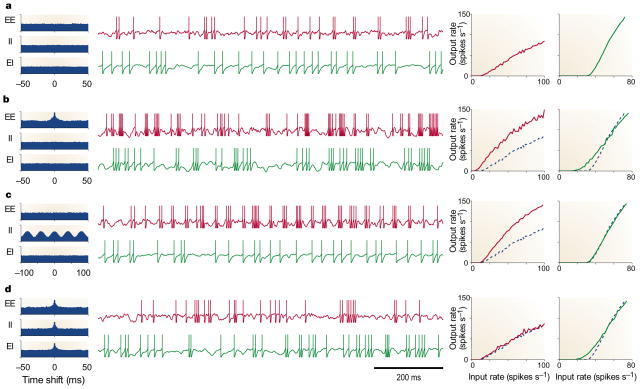
Histograms on the left show average cross-correlations, like those in FIG. 1, between pairs of excitatory inputs (EE), between pairs of inhibitory inputs (II), and between excitatory–inhibitory pairs (EI). The y axes in the correlograms extend from 0.7 to 1.4. Red and green traces correspond to responses of balanced and unbalanced neurons, respectively, always driven by 160 excitatory and 40 inhibitory inputs. The rate of inhibitory inputs was always 1.7 times the excitatory rate. In the middle traces, all excitatory inputs fired at 42 spikes s−1. In the plots on the right, the mean firing rate of the excitatory inputs varies along the x axes, and the y axes correspond to the output firing rates of the two postsynaptic model neurons. All responses were obtained using leaky integrate-and-fire models (see BOX 1). a| All input spike trains were independent. In the middle traces, both postsynaptic neurons are shown to fire at about 30 spikes s− 1. b| Excitatory inputs were synchronous, with 10% shared inputs, as in FIG. 1a. Balanced and unbalanced neurons fired at 67 and 45 spikes s− 1, respectively. c| Inhibitory inputs oscillated with an amplitude equal to 50% of the mean rate, as in FIG. 1e. Balanced and unbalanced neurons fired at 59 and 30 spikes s− 1, respectively. d| All inputs were synchronous, with 10% shared inputs. Balanced and unbalanced neurons fired at 31 and 41 spikes s− 1, respectively. For comparison, broken lines in the input–output rate plots (b–d) are the curves obtained with independent inputs (a). The balanced neuron is much more sensitive to correlations than the unbalanced one.
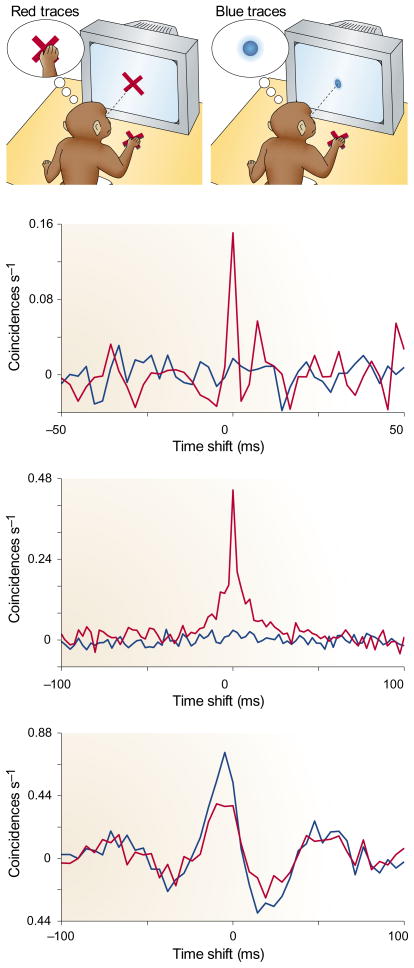
The y axis indicates the rate of spike coincidences (defined as two spikes within 2.4 ms of each other) when the spike trains from the two neurons are shifted in time by the amount shown on the x axis. These correlograms have been normalized so that a zero rate corresponds to independent spike trains. The three panels correspond to three different pairs. Red traces were calculated from trials in which the monkey paid attention to a tactile stimulus (the cross on the table); blue traces were calculated from trials in which the same tactile stimulus was presented, but the monkey had to pay attention to a visual stimulus on the screen. In the top two examples, more synchrony was observed when attention was focused on the tactile stimuli; this was the more prevalent effect. An example of lower synchrony with attention on the tactile stimulus — the less frequent effect - is shown in the lower plot. Data modified from REF. and kindly provided by P. Steinmetz.
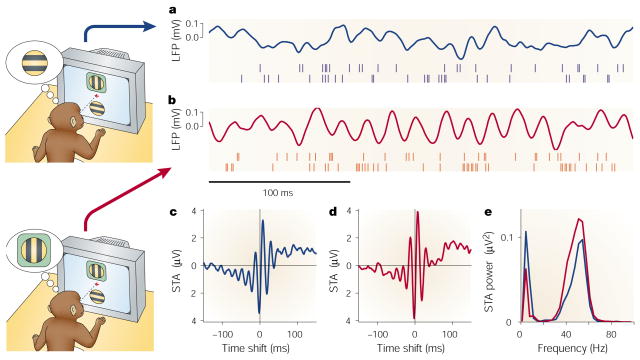
Data shown are from experiments in which two visual stimuli were presented, one inside and one outside the receptive field of a neuron in area V4. In the schematics, the green box represents the receptive field: this was not presented on the screen in the trials. Red traces correspond to attention directed inside the receptive field of the recorded neuron; blue traces correspond to attention directed outside. Stimuli were the same in the two conditions. a and b| The continuous traces show the stimulus-driven local field potentials (LFPs). The spikes below were recorded simultaneously from different electrodes. c and d| Spike-triggered averages (STAs) computed during the stimulus presentation period. The STA corresponds to the average LFP waveform that is seen at the time of a spike. The y axes indicate the mean LFP; the x axes indicate time relative to the occurrence of a spike. e| Power spectra of the two STAs shown in c and d. When attention is focused inside the receptive field, the recorded neuron tends to fire more in phase with the frequency components around 50 Hz, and less so with respect to the frequencies around 10 Hz. Data modified from REF. and kindly provided by P. Fries.
References
-
- Seidemann E, Zohary U, Newsome WT. Temporal gating of neural signals during performance of a visual discrimination task. Nature. 1998;394:72–75. A rare inquiry into how neural signals are gated. Microstimulation pulses were applied in the middle temporal visual cortex (MT) during a visual motion discrimination task. Their effect depended critically on the timing of the pulses relative to the time of stimulus presentation. - PubMed
-
- Barlow JS. The Electroencephalogram: its Patterns and Origins. MIT Press; Cambridge, Massachusetts: 1993.
-
- Borbèly AA, Hayaishi O, Sejnowski TJ, Altman JS. Human Frontier Science Program. Strasbourg: 2000. The Regulation of Sleep.
-
- Destexhe A, Sejnowski TJ. Why do we sleep? Brain Res. 2000;886:208–223. - PubMed
Publication types
MeSH terms
Grants and funding
LinkOut - more resources
Full Text Sources
