. 2001 Aug;159(2):513-25.
doi: 10.1016/S0002-9440(10)61723-3.

Blockade of receptor for advanced glycation end-products restores effective wound healing in diabetic mice

Affiliations

Blockade of receptor for advanced glycation end-products restores effective wound healing in diabetic mice

M T Goova et al. Am J Pathol. 2001 Aug.

Abstract

Receptor for advanced glycation end-products (RAGE), and two of its ligands, AGE and EN-RAGEs (members of the S100/calgranulin family of pro-inflammatory cytokines), display enhanced expression in slowly resolving full-thickness excisional wounds developed in genetically diabetic db+/db+ mice. We tested the concept that blockade of RAGE, using soluble(s) RAGE, the extracellular ligand-binding domain of the receptor, would enhance wound closure in these animals. Administration of sRAGE accelerated the development of appropriately limited inflammatory cell infiltration and activation in wound foci. In parallel with accelerated wound closure at later times, blockade of RAGE suppressed levels of cytokines; tumor necrosis factor-alpha; interleukin-6; and matrix metalloproteinases-2, -3, and -9. In addition, generation of thick, well-vascularized granulation tissue was enhanced, in parallel with increased levels of platelet-derived growth factor-B and vascular endothelial growth factor. These findings identify a central role for RAGE in disordered wound healing associated with diabetes, and suggest that blockade of this receptor might represent a targeted strategy to restore effective wound repair in this disorder.


Figures

Figure 1.
Figure 1.
Administration of soluble RAGE accelerates wound healing in db+/db+ mice. Full-thickness excisional wounds (1.5 × 1.5 cm) were created on the backs of male genetically diabetic db+/db+ mice, age 10 weeks. On days 3 to 10 after wounding, murine sRAGE or serum albumin (MSA) was administered topically (a–h) or systemically (intraperitoneal) (i). Wound edges were traced onto glass microscope slides and image analysis performed to determine wound closure (%). Percent wound closure is reported as the mean ± SE. a–g: Time course. On days 3 through 10 after wounding, mice were treated with either MSA or sRAGE (25 μg). The following numbers of mice were used: day 7: MSA, 14; sRAGE, 17; day 10: MSA, 20; sRAGE, 17; day 14: MSA, 10; sRAGE, 17; day 21: MSA, 10: sRAGE 17; and day 35: MSA, 5; sRAGE, 4 mice. Scale bar, 1.2 cm (b–g). h: Dose response. Mice were treated with the indicated dose of sRAGE or MSA. Wounds were assessed on days 10, 14, and 21 for closure (%). The following numbers of mice were used: day 10: MSA, 20; sRAGE (2.5 μg), 12; sRAGE (10 μg), 8; sRAGE (25 μg), 17 mice; day 14: MSA, 10; sRAGE (2.5 μg), 10; sRAGE (10 μg), 10; sRAGE (25 μg), 17 mice; and day 21: MSA, 10; sRAGE (2.5 μg), 8; sRAGE (10 μg), 6; sRAGE (25 μg), 17 mice. i: Systemic administration of sRAGE. On days 3 to 10 after wounding, sRAGE or MSA (50 μg) was administered daily to db+/db+ mice intraperitoneally. Percent wound closure was recorded on the indicated days. The following numbers of mice were used: MSA, n = 4 mice; and sRAGE, n = 7 mice. a and i: *, P < 0.05; and **, indicates P < 0.01.
Figure 2.
Figure 2.
a–h: Administration of soluble RAGE accelerates formation of granulation tissue, re-epithelialization, and neovascularization in db+/db+ mice. Sections from wounds of db+/db+ mice treated with either sRAGE or MSA were stained with H&E and photomicrographs were prepared. On days 10 and 14, wound margins are shown, and on days 21 and 35, wound midsections are illustrated. Scale bar, 60 μm. i: Histological score. H&E sections from MSA- and sRAGE-treated wounds were assessed for histological score, defined as: 1–3, none to minimal cell accumulation and granulation tissue or epithelial travel; 4–6, thin, immature granulation dominated by inflammatory cells but with few fibroblasts, capillaries, or collagen deposition and minimal epithelial to 7–9, moderately thick granulation tissue, ranging from being dominated by inflammatory cells to more fibroblasts and collagen deposition. This score includes extensive neovascularization; epithelium can range from minimal to moderate migration; and to 10–12, thick, vascular granulation tissue dominated by fibroblasts and extensive collagen deposition. Epithelium may partially to completely cover the wound. On days 10, 14, 21, and 35, n = 3 sRAGE-treated mice per group. The following numbers of MSA-treated mice were used: day 10, 5; day 14, 6; day 21, 4; and day 35, 3.
Figure 3.
Figure 3.
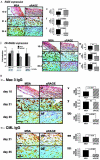
Expression of RAGE, EN-RAGEs, Mac-3, and CML epitopes in wound tissue. a–i: RAGE expression. On the indicated day after wounding, wounds from MSA- and sRAGE-treated mice (topical administration) were retrieved and immunohistochemistry performed with anti-RAGE IgG. In a and b, wound margins are shown; and in d, e, g, and h, midsections are illustrated. Representative sections from at least three mice per group are shown. Quantification was performed and is reported in c, f, and i. j–s: EN-RAGE expression. j: Immunoblotting was performed on lysates retrieved from MSA- and sRAGE-treated wounds. Representative bands from three mice per group are shown. k–s: Immunochemistry. On the indicated days, MSA- and sRAGE-treated wounds were retrieved and immunostaining performed with anti-EN-RAGE IgG. In k and l, wound margins are shown and in n, o, q, and r, midsections are illustrated. Representative sections from at least three mice per group are shown. Quantification was performed and is reported in m, p, and s. t–bb: Mac-3 epitopes. ml–hh: CML-epitopes. On the indicated days, MSA- and sRAGE-treated wounds were retrieved and immunostaining performed with anti-Mac 3 IgG or affinity-purified anti-CML IgG. In t and u, wound margins are shown; and in w, x, z, aa, ml, dd, ff, gg, midsections are illustrated. Representative sections from at least three mice per group are shown. Quantification was performed and is reported in v, y, bb, ee, and hh. Scale bars: 100 μm (a, b, k, l, t, and u); 30 μm (d, e, g, h, n, o, q, r, w, x, z, aa, ml, dd, ff, and gg).
Figure 4.
Figure 4.
Expression of TNF-α and IL-6 in wound tissue. a and k: Immunoblotting was performed on lysates retrieved MSA- and sRAGE-treated wounds using anti-TNF-α IgG (a) or anti-IL-6 IgG (k). Representative bands from at least three mice per group are shown. b–j and l–t: Immunohistochemistry. On the indicated days, MSA- and sRAGE-treated wounds were retrieved and immunostaining performed using anti-TNF-α IgG (b–j) or anti-IL-6 IgG (l–t). In b, c, l, and m wound margins are shown; and in e, f, h, i, o, p, r, and s, midsections are illustrated. Quantification was performed and is reported in d, g, j, n, q, and t. Representative sections from at least three mice per group are shown. Scale bars: 100 μm (b, c, l, and m); 30 μm (e, f, h, i, o, p, r, and s).
Figure 5.
Figure 5.
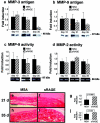
Expression of MMP antigen/activity, and collagen content in wound tissue. a and b: Immunoblotting was performed on lysates retrieved from MSA- and sRAGE-treated wounds using anti-MMP-3 (a) or anti-MMP-9 IgG (b). Representative bands from at least three mice per group are shown. c–d: Zymography was performed on lysates retrieved from MSA- and sRAGE-treated wounds. Representative bands from at three mice per group are shown. e–j: Picrosirius red stain. On days 21 and 35, MSA- and sRAGE-treated wounds were retrieved and sections stained with Picrosirius red. Areas of collagen in the wound midsections are indicated by red stain. Quantification was performed and is reported in g and j. Representative sections from at least three mice per group are shown. Scale bars, 100 μm (e, f, h, and i).
Figure 6.
Figure 6.
Expression of PDGF-B and VEGF in wound tissue. Immunoblotting was performed on lysates retrieved from sRAGE- and MSA-treated wounds using either anti-PDGF-B IgG (a) or anti-VEGF IgG (b). Representative bands from at least three to four mice per group are shown.
Figure 7.
Figure 7.
Blockade of RAGE restores effective wound healing in db+/db+ mice. In diabetes, influx of inflammatory cells such as PMNs and MPs into wound foci is markedly delayed. RAGE-bearing inflammatory cells are trapped by AGEs within the dermis (arrows; red segments). Once they gain access to the wound (arrows; yellow ⇒ green segments), however, inflammatory cells such as MPs, along with other RAGE-bearing effector cells (such as fibroblasts and endothelial cells), interact with AGEs and EN-RAGEs. Activation of RAGE initiates a cascade of cellular activation, typified by generation of cytokines and MMPs (green arrows). Delayed egress of inflammatory cells portends ongoing stimulation of RAGE, sustained inflammation, and failure of reparative/remodeling processes. We speculate that blockade of RAGE both hastens and appropriately limits the inflammatory phase of wound healing in diabetes, thereby promoting closure.

Comment in

References

    1. Goodson WH, Hunt TK: Wound healing and the diabetic patient. Surg Gynecol Obstet 1979, 149:690-698 - PubMed
    1. Morain WD, Colen LB: Wound healing in diabetes mellitus. Clin Plast Surg 1990, 17:493-501 - PubMed
    1. Goodson WH, Hunt TK: Studies of wound healing in experimental diabetes. J Surg Res 1977, 22:221-227 - PubMed
    1. Schaffer CJ, Nanney LB: Cell biology of wound healing. Int Rev Cytol 1996, 169:151-181 - PubMed
    1. Ehrlich HP: The physiology of wound healing. A summary of normal and abnormal wound healing processes. Adv Wound Care 1998, 11:326-328 - PubMed

Publication types

MeSH terms

Substances