. 2001 Aug 15;21(16):5902-15.
doi: 10.1523/JNEUROSCI.21-16-05902.2001.

Paradoxical role of large-conductance calcium-activated K+ (BK) channels in controlling action potential-driven Ca2+ entry in anterior pituitary cells

Affiliations

Paradoxical role of large-conductance calcium-activated K+ (BK) channels in controlling action potential-driven Ca2+ entry in anterior pituitary cells

F Van Goor et al. J Neurosci. .

Abstract

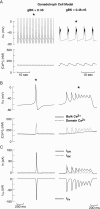
Activation of high-conductance Ca(2+)-activated K(+) (BK) channels normally limits action potential duration and the associated voltage-gated Ca(2+) entry by facilitating membrane repolarization. Here we report that BK channel activation in rat pituitary somatotrophs prolongs membrane depolarization, leading to the generation of plateau-bursting activity and facilitated Ca(2+) entry. Such a paradoxical role of BK channels is determined by their rapid activation by domain Ca(2+), which truncates the action potential amplitude and thereby limits the participation of delayed rectifying K(+) channels during membrane repolarization. Conversely, pituitary gonadotrophs express relatively few BK channels and fire single spikes with a low capacity to promote Ca(2+) entry, whereas an elevation in BK current expression in a gonadotroph model system leads to the generation of plateau-bursting activity and high-amplitude Ca(2+) transients.


Figures

Fig. 1.
Fig. 1.
Distinct patterns of AP firing and [Ca2+]i signaling in rat gonadotrophs and somatotrophs. A, Simultaneous recording ofVm and [Ca2+]i in an identified gonadotroph (left) and somatotroph (right), using the perforated patch-clamp recording configuration in the current-clamp mode. B, Expanded time scale of the AP and associated [Ca2+]i signal identified in each cell type by the asterisks in A. Representative tracings from 26 gonadotrophs and 34 somatotrophs are shown.
Fig. 2.
Fig. 2.
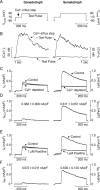
Differential expression of BK channels between gonadotrophs and somatotrophs. A, A two-pulse protocol was used to monitor IKCaactivation by voltage-gated Ca2+ entry. This protocol consisted of a 100 msec conditioning pulse to −10 mV to activated VGCCs, followed by a 500 msec test pulse to +90 mV, during which the peak IK was monitored.B, Change in [Ca2+]ievoked by two-pulse protocol and by the test pulse alone in gonadotrophs (left) and somatotrophs (right). C, Extracellular Ca2+ removal reduced IKevoked by the two-pulse protocol in gonadotrophs and somatotrophs.D, The net IKCaactivated by the two-pulse protocol in gonadotrophs (n = 9) and somatotrophs (n = 15) was obtained by subtracting the current evoked in Ca2+-deficient medium from the control current.E, Application of 1 μm paxilline reducedIK evoked by the two-pulse protocol in gonadotrophs and somatotrophs. F, The net paxilline-sensitive IBK activated by the two-pulse protocol in gonadotrophs (n = 11) and somatotrophs (n = 15). The mean ± SEMs of the peak IKCa andIBK evoked during the test pulse are shown in D and F, respectively. The peakIBK isolated by 100 nm IBTX subtraction in gonadotrophs (n = 5) and somatotrophs (n = 10) was 0.089 ± 0.012 and 0.521 ± 0.36 nA/pF, respectively. To account for differences in cell size between gonadotrophs and somatotrophs, we normalized all currents to the membrane capacitance of each cell that was examined.
Fig. 3.
Fig. 3.
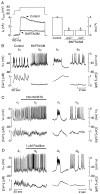
Dependence of the plateau-bursting activity in somatotrophs on the activation of BK channels. A,Left, Representative IKtracings evoked by the two-pulse protocol in somatotrophs preincubated with DMSO (Control) or BAPTA AM (20 μm) for 45 min at 37°C. A,Right, Mean ± SEM of the peakIK evoked by the two-pulse protocol in somatotrophs preincubated with DMSO (n = 5), BAPTA AM (n = 5), and BAPTA AM in the absence of extracellular Ca2+ (n = 5).B, Left, Simultaneous measurement of the membrane potential and [Ca2+]i in somatotrophs preincubated with DMSO (Control) or BAPTA AM. B, Right, Expanded time scale of AP and associated [Ca2+]i signals identified in the left panel byb1 (Control) andb2 (BAPTA/AM). Representative tracings from five controls and BAPTA AM-loaded somatotrophs are shown. C, D, Left, Simultaneous measurement of the membrane potential and [Ca2+]i in somatotrophs before and during (horizontal bar) the application of 100 nm IBTX (n = 14) or 1 μm paxilline (n = 4). C, D, Right, Expanded time scale of the AP and associated [Ca2+]i signals before (c1 andd1) and during the application of IBTX (c2) or paxilline (d2).
Fig. 4.
Fig. 4.
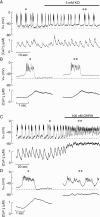
Effects of KCl- and GHRH-induced membrane depolarization on the pattern of AP firing in somatotrophs.A, Simultaneous measurement of membrane potential and [Ca2+]i before and during the application of 5 mm KCl (horizontal bar) in a spontaneously active somatotroph. B, Expanded time scale of the AP and associated [Ca2+]isignals before (single asterisks) and during (double asterisks) KCl application. C, Simultaneous measurement of membrane potential and [Ca2+]i before and during the application of 100 nm GHRH (horizontal bar) in a spontaneously active somatotroph. D, Expanded time scale of the AP and associated [Ca2+]isignals before (single asterisks) and during (double asterisks) KCl application. Dashed lines indicate the baseline potential before the application of KCl or GHRH.
Fig. 5.
Fig. 5.
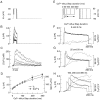
Relationship between spike amplitude and delayed rectifying K+ channel activation in somatotrophs. A, Simultaneous measurement of membrane potential and [Ca2+]i before and during the application of 100 nm IBTX in a spontaneously active somatotroph. The dashed lines indicate the change in peak spike amplitude with and without (IBTX) BK channel activation. B, Representative tracing of the isolated delayed rectifying K+ current (IDR) in response to 1 sec membrane potential steps from a holding potential of −90 mV to −90, −20, −10, 0, and 10 mV. C, Current–voltage relation of the early (0–25 msec; filled circles) and late (990–1000 msec; open circles) IDRevoked by 1 sec membrane potential steps from −80 to 20 mV (holding potential, −90 mV; mean ± SEM; n = 6).D, Time constant (τ) of IDRactivation during 1 sec membrane potential steps from a holding potential of −90 mV to −20, −10, 0, and 10 mV. The time constant of activation for the IDR was best determined by a single exponential fit.
Fig. 6.
Fig. 6.
Delayed rectifyingIK evoked by prerecorded single spike and plateau-burst command potentials in somatotrophs. A, A single spike (Spike AP) and plateau-burst (Burst AP) AP waveform were prerecorded from a spontaneously active gonadotroph and somatotroph, respectively, and then used as the command potential under voltage-clamp recording conditions. B, Representative current trace of the isolatedIDR evoked by the spike (holding potential, −50 mV) and burst (holding potential, −60 mV) AP waveforms in the same somatotroph. The mean ± SEM of the peakIDR evoked by the spike (open bar) and burst (hatched bar) AP waveform (n = 8) is shown on the right.Asterisks denote significant differences (p < 0.01, paired t test).C, Expanded time scales of the spike (left) and burst (right) AP waveforms (dashed lines) and the evokedIDR (solid line) shown inA. Note the different y-axis scales between the left and rightpanels.
Fig. 7.
Fig. 7.
Dissociation betweenIBK and bulk [Ca2+]i kinetics in somatotrophs. A series of Ca2+ influx steps ranging from 0 to 300 msec was given before the application of a single test pulse to +90 mV (A), during which theIK (B) and bulk [Ca2+]i (C) were monitored simultaneously. D, The mean ± SEM of the peak IK (solid line) and [Ca2+]i (dotted line) from 19 somatotrophs was plotted against the Ca2+influx step duration. E, Expanded time scale of the tracings in B and C showing both theIK (solid lines) and change in bulk [Ca2+]i (dotted lines) evoked by Ca2+ influx steps of 0 and 5 msec (F), 25 and 50 msec (G), and 100, 200, and 300 msec (H) in duration. For clarity, the two-step protocol is not shown to scale, and not all steps are labeled.
Fig. 8.
Fig. 8.
Effects of endogenous and exogenous Ca2+ buffers on IBK in somatotrophs. Representative current tracings evoked by the two-pulse protocol in the presence of the endogenous Ca2+buffers (A) or the slow and fast exogenous Ca2+ buffers, 100 μm EGTA (B) and 100 μm BAPTA (C), respectively. The endogenous Ca2+ buffers were preserved by using the perforated patch recording configuration, whereas the exogenous Ca2+ buffers were introduced into the cytoplasm by the recording pipette via standard whole-cell recording techniques.D, The mean ± SEM of the isolatedIBK evoked by the two-pulse protocol in the presence of the endogenous Ca2+ buffers (n = 15) or the exogenous Ca2+buffers EGTA (n = 5) or BAPTA (n = 3).
Fig. 9.
Fig. 9.
Voltage-dependent inactivation and deactivation properties of IBK in somatotrophs. A, To determine whether the BK channels in somatotrophs inactivate during sustained membrane depolarizations, we applied 1 sec depolarizing voltage steps from −90 to +70 mV (holding potential, −90 mV). B, Representative current traces of the isolated IBK from nine somatotrophs. The isolated IBK was obtained by subtracting the IBTX- or paxilline-sensitive current from the total current.C, Current–voltage relation of the early (open circles; 0–25 msec) and late (filled circles; 990–1000 msec) IBK shown in B. D, The relationship between the clearance of domain Ca2+ andIBK activation was monitored by using a modified two-pulse protocol, during which the membrane potential was stepped back to −90 mV for 0–300 msec before the application of the test pulse. E, Representative current traces evoked by the modified two-pulse protocol. F, The mean ± SEM (n = 5) of the peak IKevoked during the test pulse in the absence of a Ca2+ influx step and after an interstep interval of 0–300 msec in duration. The continuous line is a single exponential fit to the data.
Fig. 10.
Fig. 10.
Profile of theIDR and IBKunderlying the generation of plateau-bursting activity in somatotrophs.A, In seven somatotrophs theIBK evoked by the prerecorded burst AP (top panel) was isolated from theIDR by subtracting the paxilline-sensitive current from the total current. Representative current tracings are shown. B, Expanded time scale of the burst AP command potential (top panel) and the underlyingIDR and IBK shown in A. C, Expanded time scale of the burst AP waveform and the isolated IDR andIBK from the gonadotroph model cell expressing BK channels (Fig. 11C, right panel, top and bottom traces).
Fig. 11.
Fig. 11.
Introduction of BK channels into the gonadotroph model cell shifts the pattern of AP firing from single spiking to plateau bursting. A, Pattern of AP firing and the associated changes in bulk Ca2+ concentration in the gonadotroph model cell in the absence (left) and presence (right) of BK channels. On the basis of the experimental evidence, BK channels in the model cells responded to fluctuations of domain Ca2+ concentration near the opening of the L-type Ca2+ channels, whereas SK channels responded to submembrane Ca2+concentrations. B, Expanded time scale of the AP and the associated Ca2+ transients identified inA by the asterisks. C, Isolated ionic currents underlying the generation of the single spike AP (left) and plateau-burst AP (right) identified in B.

Similar articles

Cited by

References

    1. Adler EM, Augustine GJ, Duffy SN, Charlton MP. Alien intracellular calcium chelators attenuate neurotransmitter release at the squid giant synapse. J Neurosci. 1991;11:1496–1507. - PMC - PubMed
    1. Araque A, Buno W. Fast BK-type channel mediates the Ca2+-activated K+ current in crayfish muscle. J Neurophysiol. 1999;82:1655–1661. - PubMed
    1. Barrett JN, Magleby KL, Pallotta BS. Properties of single calcium-activated potassium channels in cultured rat muscle. J Physiol (Lond) 1982;331:211–230. - PMC - PubMed
    1. Barry PH. JPCalc, a software package for calculating liquid junction potential corrections in patch-clamp, intracellular, epithelial, and bilayer measurements. J Neurosci Methods. 1994;51:107–116. - PubMed
    1. Behrens R, Nolting A, Reimann F, Schwarz M, Waldschutz R, Pongs O. HKCNMB3 and hKCNMB4, cloning and characterization of two members of the large-conductance calcium-activated potassium channel β-subunit family. FEBS Lett. 2000;474:99–106. - PubMed

Publication types

MeSH terms

LinkOut - more resources