. 2001 Aug 15;21(16):5944-51.
doi: 10.1523/JNEUROSCI.21-16-05944.2001.

Neuronal Ca(V)1.3alpha(1) L-type channels activate at relatively hyperpolarized membrane potentials and are incompletely inhibited by dihydropyridines

Affiliations

Neuronal Ca(V)1.3alpha(1) L-type channels activate at relatively hyperpolarized membrane potentials and are incompletely inhibited by dihydropyridines

W Xu et al. J Neurosci. .

Abstract

L-type calcium channels regulate a diverse array of cellular functions within excitable cells. Of the four molecularly defined subclasses of L-type Ca channels, two are expressed ubiquitously in the mammalian nervous system (Ca(V)1.2alpha(1) and Ca(V)1.3alpha(1)). Despite diversity at the molecular level, neuronal L-type channels are generally assumed to be functionally and pharmacologically similar, i.e., high-voltage activated and highly sensitive to dihydropyridines. We now show that Ca(V)1.3alpha(1) L-type channels activate at membrane potentials approximately 25 mV more hyperpolarized, compared with Ca(V)1.2alpha(1). This unusually negative activation threshold for Ca(V)1.3alpha(1) channels is independent of the specific auxiliary subunits coexpressed, of alternative splicing in domains I-II, IVS3-IVS4, and the C terminus, and of the expression system. The use of high concentrations of extracellular divalent cations has possibly obscured the unique voltage-dependent properties of Ca(V)1.3alpha(1) in certain previous studies. We also demonstrate that Ca(V)1.3alpha(1) channels are pharmacologically distinct from Ca(V)1.2alpha(1). The IC(50) for nimodipine block of Ca(V)1.3alpha(1) L-type calcium channel currents is 2.7 +/- 0.3 microm, a value 20-fold higher than the concentration required to block Ca(V)1.2alpha(1). The relatively low sensitivity of the Ca(V)1.3alpha(1) subunit to inhibition by dihydropyridine is unaffected by alternative splicing in the IVS3-IVS4 linker. Our results suggest that functional and pharmacological criteria used commonly to distinguish among different Ca currents greatly underestimate the biological importance of L-type channels in cells expressing Ca(v)1.3alpha(1).


Figures

Fig. 1.
Fig. 1.
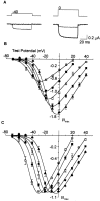
Two classes of L-type Ca channel activate at different voltages. A, Individual current traces measured from Xenopus oocytes transiently expressing Cav1.3α1 (thick traces) and Cav1.2α1 (thin traces), together with CaVβ1b, using 5 mm barium as the charge carrier. Currents were activated in response to voltage steps as indicated from a holding potential of −80 mV. B, Averaged, peak current–voltage plots for Cav1.3α1 (●) and Cav1.2α1 (○) channels using 5 mm barium as charge carrier. C, D, same as in A and B, except recordings were obtained using 5 mm calcium as the charge carrier. V1/2 from peak current–voltage plot: with 5 mm barium as the charge carrier, Cav1.3α1 and CaVβ1b, −36.8 ± 0.8 mV (n = 6); Cav1.2α1 and CaVβ1b, −8.8 ± 0.8 mV (n = 6); with 5 mm calcium as the charge carrier, −20.0 ± 2.2 mV (n = 4) and 3.3 ± 2.0 mV (n = 4), respectively. Values are mean ± SE.
Fig. 2.
Fig. 2.
An increase in extracellular divalent cation concentration shifts the voltage dependence of CaV1.3α1 activation to depolarized potentials. A, Individual current traces measured fromXenopus oocytes transiently expressing CaV1.3α1 together with CaVβ1b, using 2 mm barium (thin trace) or 40 mm barium (thick trace) as the charge carrier. B, C, CaV1.3α1 channel currents recorded with 2 mm barium (○), 5 mm barium (●), 10 mm barium (■), 20 mm barium (▪), and 40 mm barium (▴). Values plotted are averaged peak currents measured from each cell normalized to the maximum peak currents recorded with 5 mm barium (B) and averaged peak currents normalized to maximum peak current recorded at each barium concentration (C). V1/2 from peak current–voltage plots: 2 mm barium, −42.7 ± 1.6 mV (n = 5); 5 mm barium, −33.8 ± 0.8 mV (n = 5); 10 mm barium, −29.6 ± 1.8 mV (n = 5); 20 mm barium, −24.7 ± 1.2 mV (n = 4); and 40 mm barium, −18.9 ± 1.6 mV (n = 4).
Fig. 3.
Fig. 3.
CaV1.3α1 channels open at relatively hyperpolarized voltages independent of several factors that potentially affect the voltage dependence of activation. Shown are comparisons of normalized, averaged peak current–voltage plots of CaV1.3α1 coexpressed with CaVβ1b (●), CaVβ2a (○), CaVβ3(▪), or CaVβ4 (■) subunits (A); with (●) or without (○) exon 32, which encodes a 15-amino acid sequence, PSDSENIPLPTATPG, in domain IVS3–IVS4 coexpressed with CaVβ1b(B); with (●) or without (○) exon 11, which encodes a 20-amino acid sequence, CWWKRRGAAKTGPSGCRRWG, in loop I–II coexpressed with CaVβ1b(C); and with exon 42 (●) or exon 42a (○) coexpressed with CaVβ1b(D), Ca channel currents were recorded with 5 mm barium as the charge carrier. Maximum, peak current amplitudes induced by coexpressing Cav1.3α1with different CaVβ subunits were −1.3 ± 0.1 μA (n = 7; CaVβ1b), −2.8 ± 0.2 μA (n = 8; CaVβ2a), −1.0 ± 0.1 μA (n = 7; CaVβ3), and −1.0 ± 0.5 μA (n = 4; CaVβ4). Cav1.3α1 alone induced currents with amplitudes of −0.43 ± 0.05 μA (n = 6). Average V1/2 values were: A, −33.0 ± 1.0 mV (n = 7; CaVβ1b), −32.1 ± 0.8 mV (n = 8; CaVβ2a), −28.4 ± 0.5 mV (n = 7; CaVβ3), and −30.0 ± 1.0 mV (n = 4; CaVβ4);B, −35.7 ± 0.5 mV (n = 8; Δexon 32) and −31.7 ± 0.7 mV (n = 5; +exon 32); C, −36.1 ± 1.6 mV (n = 8; Δexon 11) and −35.3 ± 0.6 mV (n = 5; +exon 11); and D, −33.9 ± 1.5 mV (n = 3; +exon42) and −32.9 ± 0.4 mV (n = 5; +exon 42a). Values are mean ± SE.
Fig. 4.
Fig. 4.
CaV1.3α1 channels open at relatively hyperpolarized voltages independent of expression system. Shown are normalized, averaged peak-CaV1.3α1channel current–voltage plots recorded from Xenopusoocytes expressing CaV1.3α1 and CaVβ3 (5 mm Ba, ▪) and tsA-201 cells expressing CaV1.3α1, CaVβ3, and CaVα2δ (5 mm Ba, ●; and 2 mm Ca, ○). Maximum peak currents were −1.0 ± 0.1 μA (n = 7, ▪), −1.2 ± 0.1 nA (n = 3, ●), and −3.3 ± 1.0 nA (n = 4, ○). Average V1/2 values were −28.4 ± 0.5 mV (n = 7, ▪), −26.8 ± 0.7 mV (n = 3, ●), and −31.0 ± 0.8 mV (n = 4; ○), respectively. Values are mean ± SE.
Fig. 5.
Fig. 5.
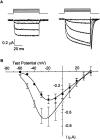
CaV1.3α1 currents were enhanced by Bay K 8644. A, CaV1.3α1 currents in the absence (left) and presence (right) of 1 μm Bay K 8644. Currents were activated from a holding potential of −80 mV. B, Averaged, peak current–voltage plots of CaV1.3α1 channels recorded with 5 mm barium in control (●) and in the presence of 1 μm Bay K 8644 (○). Maximum peak currents were −0.4 ± 0.1 μA (n = 3, ●) and −0.7 ± 0.1 μA (n = 3, ○). Average V1/2 values were −32.2 ± 1.1 mV in control (n = 3, ●) and −39.0 ± 2.5 mV in the presence of Bay K 8644 (n = 3, ○).
Fig. 6.
Fig. 6.
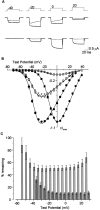
CaV1.3α1 currents are partially inhibited by dihydropyridines. A, CaV1.3α1 (top) and CaV1.2α1 (bottom) in the absence (thick traces) and presence (thin traces) of 1 μm nimodipine. Currents were activated by voltage steps as indicated, from a holding potential of −80 mV. B, Comparison of normalized, averaged peak current–voltage plots of CaV1.3α1 and CaV1.2α1 channels in the absence (●, ▪) and presence (○, ■) of 1 μm nimodipine, respectively.C, Peak CaV1.3α1 (light gray) and peak CaV1.2α1 (dark gray) currents remaining in the presence of nimodipine, plotted as percentage of control currents at various test potentials. Values are mean ± SE; n = 6 for CaV1.3α1 and n = 3 for CaV1.2α1.
Fig. 7.
Fig. 7.
CaV1.3α1 and CaV1.2α1 channels are pharmacologically distinct. A, Dose–response curve of nimodipine inhibition of CaV1.3α1 (●) and CaV1.2α1 (○) channel currents. Data were fit to the Hill equation: (IcontolInimodipine)/Icontrol= 1/(1 + (IC50/Cnimodipine)h), where IC50 is the concentration of nimodipine required to inhibit 50% of peak current, and h is the Hill coefficient. CaV1.3α1, IC50 = 2.7 ± 0.3 μm;h = 0.85 ± 0.04 (n = 5); CaV1.2α1, IC50 = 139 ± 12 nm;h = 0.63 ± 0.05 (n = 5). B, Inhibition of CaV1.3α1 (Δexon 32, light gray, n = 8; +exon 32, dark gray, n = 6) and CaV1.2α1 (white,n = 4) by nitrendipine are significantly different at concentrations of 1 and 10 μm. Values are mean ± SE.

Similar articles

Cited by

References

    1. Ashcroft FM, Proks P, Smith PA, Ammala C, Bokvist K, Rorsman P. Stimulus-secretion coupling in pancreatic beta cells. J Cell Biochem. 1994;55:54–65. - PubMed
    1. Avery RB, Johnston D. Multiple channel types contribute to the low-voltage-activated calcium current in hippocampal CA3 pyramidal neurons. J Neurosci. 1996;16:5567–5582. - PMC - PubMed
    1. Beam KG, Tanabe T, Numa S. Structure, function, and regulation of the skeletal muscle dihydropyridine receptor. Ann NY Acad Sci. 1989;560:127–137. - PubMed
    1. Bean BP. Nitrendipine block of cardiac calcium channels: high-affinity binding to the inactivated state. Proc Natl Acad Sci USA. 1984;81:6388–6392. - PMC - PubMed
    1. Bean BP. Classes of calcium channels in vertebrate cells. Annu Rev Physiol. 1989;51:367–384. - PubMed

Publication types

MeSH terms

Associated data