. 2001 Aug 15;21(16):6095-104.
doi: 10.1523/JNEUROSCI.21-16-06095.2001.

Ducky mouse phenotype of epilepsy and ataxia is associated with mutations in the Cacna2d2 gene and decreased calcium channel current in cerebellar Purkinje cells

Affiliations

Ducky mouse phenotype of epilepsy and ataxia is associated with mutations in the Cacna2d2 gene and decreased calcium channel current in cerebellar Purkinje cells

J Barclay et al. J Neurosci. .

Abstract

The mouse mutant ducky, a model for absence epilepsy, is characterized by spike-wave seizures and ataxia. The ducky gene was mapped previously to distal mouse chromosome 9. High-resolution genetic and physical mapping has resulted in the identification of the Cacna2d2 gene encoding the alpha2delta2 voltage-dependent calcium channel subunit. Mutations in Cacna2d2 were found to underlie the ducky phenotype in the original ducky (du) strain and in a newly identified strain (du(2J)). Both mutations are predicted to result in loss of the full-length alpha2delta2 protein. Functional analysis shows that the alpha2delta2 subunit increases the maximum conductance of the alpha1A/beta4 channel combination when coexpressed in vitro in Xenopus oocytes. The Ca(2+) channel current in acutely dissociated du/du cerebellar Purkinje cells was reduced, with no change in single-channel conductance. In contrast, no effect on Ca(2+) channel current was seen in cerebellar granule cells, results consistent with the high level of expression of the Cacna2d2 gene in Purkinje, but not granule, neurons. Our observations document the first mammalian alpha2delta mutation and complete the association of each of the major classes of voltage-dependent Ca(2+) channel subunits with a phenotype of ataxia and epilepsy in the mouse.


Figures
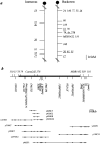
Fig. 1.
Fig. 1.
Genetic and physical maps define thedu critical region. a, Genetic map around the du locus. The relation of the du gene to markers is shown to scale on partial chromosome linkage maps. Eight hundred ninety-six meioses of the (TKDU-+/du × STOCK Dll3pu +Tyrc-ch/+ p Tyrc-ch) F1 intercross placedu between D9Mit51 andD9Mit20 (2.9 ± 0.1 cM). Five hundred sixty-four meioses from an intersubspecific backcross [(TKDU-+/du × CAST/Ei) × TKDU-+/du] show that D9Mit78 andMDB1432 flank du, placing it in a 0.8 ± 0.3 cM interval. D9Mit prefixes have been removed from the markers for clarity. Underlined markers were typed in both crosses. b, Physical map of thedu region. Markers ordered genetically are shown above the horizontal line, and those ordered on the physical map only are placed below. The region around du is indicated by a filled bar. A contig of YACs was assembled as illustrated. Library identification is prefixed with y. Four PAC clones are indicated and prefixed withp. Marker content in genomic clones is indicated byfilled circles aligned with markers on the physical map. Gene symbols are as follows: Sema3B,semaphorin3B; Dag1,dystroglycan1; Lamb2,lamininβ2.
Fig. 2.
Fig. 2.
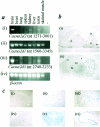
Cacna2d2 is predominantly expressed in brain in a pattern distinct from Cacna2d1 but similar to Cacna2d3. a, Expression ofCacna2d2, Cacna2d1, andCacna2d3 by RT-PCR of P28 +/+ mouse tissue RNA. β-Actin primers were used to allow comparisons of transcript levels. Negative control was no RNA. i,Cacna2d2-12F/14R; ii,Cacna2d1-1F/1R; iii,Cacna2d3-1F/1R; iv, β-actin.b, In situ hybridization analyses of whole-brain sections (P21 +/+) with a DIG-labeled antisenseCacna2d2 RNA probe (nt 3705–4909). i, Sagittal section demonstrates the highest level of expression in cerebellum (cb), with some expression also in medulla (m), pons (p), and striatum (st). ii, The horizontal section shows expression in cortex (cx), nucleus reticularis thalami (nrt), habenula (ha), and hippocampus (h). c, Detailed examination of some of these areas by in situ hybridization with the same probe as above. Moderate expression is seen in medulla (i), and higher levels were seen in a subpopulation of cells of the striatum (ii) and cerebral cortex in a large proportion of cortical neurons throughout all layers (iii). Uniform expression is seen in nRT (iv), habenula (v), and hippocampus (vi). Scale bar: Ci–Ciii, 100 μ m; Civ, Cv, 50 μm.
Fig. 3.
Fig. 3.
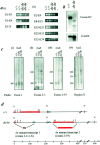
The du mutation is a genomic rearrangement involving the Cacna2d2 gene.a, Two mutant transcripts can be identified by RT-PCR of total brain RNA from du/du mice. Two +/+, twodu/du samples, and a negative control (no RNA) are shown per gel. i, Top, Normal size amplification product of exons 1–3 is shown in +/+ anddu/du RNA, with reduced levels in the latter.Middle, Amplification between exons 1 and 4 does not produce a product in du/du RNA, suggesting disruption of the Cacna2d2 gene in this region. Bottom, Amplification of the du-specific chimeric transcript ofCacna2d2 exons 1, 2, and 3 and a novel sequence X.ii, Overlapping PCR fragments spanning exons 2–39 of Cacna2d2 can be detected in +/+ anddu/du RNA, with lower levels observed indu/du samples. b, Wild-typeCacna2d2 transcript (5.5 kb) is absent fromdu/du brain by Northern analysis using cerebellar mRNA and full-length Cacna2d2 as a probe. Low levels of twodu-specific bands (∼1.5 and 5 kb) are detected. The filter was rehybridized with β-actin as a control for RNA loading.c, PFGE shows duplication of Cacna2d2exons 2 and 3 and region X in du/du genomic DNA. Southern analysis of NotI-digested genomic DNA separated by PFGE from +/+, +/du, and du/du mice is shown. Blots were hybridized with Cacna2d2 probes:i, exon 1; ii, exons 2–3;iii, exons 4–39; iv, region X. Sizes are in kilobases. d, A scale representation of the genomic region containing Cacna2d2 (red) and region X (blue) in +/+ and du/du mice.N, NotI sites. The presence of one or two B2 repeats 5′ to region X is marked by a vertical line. The mutant transcripts 1 and 2 produced from each region indu/du are represented by colored boxes. The Cacna2d2 gene is arranged 5′ to 3′ in +/+. Indu/du, exons encoding mutant transcript 1 are shown in a 5′ to 3′ direction, and those encoding mutant transcript 2 are inverted and shown 3′ to 5′. The distance between exon 3 and region X is unknown but is >12 kb. The scale bar is in kilobases.
Fig. 4.
Fig. 4.
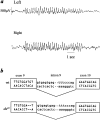
du2J/du2Jmice show 5–7 Hz SWD on cortical EEG and a 2 bp deletion inCacna2d2. a, Representative EEG recordings of seizures from homozygousdu2J/du2J mice (n = 8). Low- and high-frequency filters were set at 0.3 and 35 Hz, respectively. Traces from cortical bipolar electrodes implanted in the left and right hemispheres are illustrated. These spike-wave discharges accompanied behavioral arrest. Control mice (n = 2) showed no abnormal activity (data not shown). b, Schematic representation of exons 9 and 10 and intron 9 of theCacna2d2 gene in +/+ anddu2J/du2Jgenomic DNA.
Fig. 5.
Fig. 5.
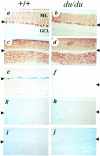
Analysis of Cacna2d2,Cacna2d1, and Cacna2d3 expression in cerebellum of P21 +/+ and du/du mice. a,b, Immunohistochemical detection of calbindin showing no obvious differences in PC number in du/du(b) compared with +/+ (a) cerebellum. c, d, Calretinin immunostaining shows no difference in GC staining between +/+ (c) and du/du(d) cerebellum. In situhybridization of +/+ and du/du sections with a 3′Cacna2d2 antisense RNA probe. Analyses were performed on +/+ (e) and du/du(f) sections. This probe does not detect any expression in the du/du PCs (f). In situ hybridization with Cacna2d1 (g,h) and Cacna2d3 (i,j) probes. (For a–j,n = 3 for each genotype and experiment.) For all three riboprobes used, no signal was detected on hybridization of control sense RNA to +/+ sections (results not shown). Scale bar:a–j, 100 μm. The PCL is indicated by anarrowhead, and the ML is uppermost in all sections. A small region of cerebellum is shown throughout for clarity.
Fig. 6.
Fig. 6.
The effect of α2δ2 on α1A/β4 calcium channel currents expressed in Xenopus oocytes.a, b, Calcium channel currents recorded in 5 mm Ba2+ from Xenopusoocytes injected with either α1A/β4 (a) or α1A/α2δ2/β4 (b). For clarity, only the currents on the rising phase of the I–V relationship are shown. c, I–V relationship of α1A/β4 (○) and α1A/α2δ2/β4 (●) peak currents (n = 14 and 13, respectively). The meanI–V relationships were fitted with a combined Boltzmann and linear fit, as described in Materials and Methods. No significant differences were observed in the Vrev ork (results not shown). d, Steady-state inactivation of α1A/β4 (○) and α1A/α2δ2/β4 (●) currents (n = 14 and 13, respectively) were obtained by stepping to the conditioning potential for 25 sec, before measuring the current at the test potential of 0 mV. Individual data were fitted with a single Boltzmann equation of the formI/Imax = 1/(1 + exp[(VV50)/k]), wherek is the slope factor and V50is the voltage for 50% steady-state inactivation of the current. TheV50(inactivation) was −41.73 ± 1.0 mV for α1A/β4 and −41.68 ± 1.1 mV for α1A/α2δ2/β4.
Fig. 7.
Fig. 7.
Calcium channel currents in cerebellar Purkinje cells and granule cells. a, I–Vrelationships in PCs from +/+ (n = 19), +/du (n = 32), anddu/du (n = 14) mice. Genotypes as indicated in the figure. Cells were held at −80 mV. At −10 mV, theIBa density was −84.9 ± 8.2, −90.5 ± 7.8, and −54.2 ± 8.9 pA/pF in the +/+, +/du, and du/du PCs, respectively (p < 0.05 for du/du vs +/+;p < 0.01 for du/du vs +/du). There was no significant difference between the genotypes in the kinetics of activation or in the inactivation over 50 msec. The 10–90% rise times at −10 mV were 3.5 ± 0.2, 3.4 ± 0.2, and 3.9 ± 0.2 msec in +/+, +/du, anddu/du PCs, respectively, and the respective percentage of inactivation in 50 msec was 13.6 ± 1.3, 16.4 ± 0.9, and 17.1 ± 2.0%. Calibration: 30 pA/pF, 20 msec. b, Example current traces from +/+, +/du, anddu/du PCs. The currents were elicited by 50 msec voltage steps from −70 to −10 mV. IBa density is reduced in PCs from du/du mice compared with +/+ mice.c, Ca2+ channel activity in cell-attached patches from PCs of +/+ (left; two overlapping openings are evident, indicative of at least two channels active in the patch of membrane recorded), +/du(middle; two channels in patch), anddu/du (right; single channel) mice.Top, The voltage protocol; holding potential, −70 mV; test potential, +20 mV, for 500 msec, delivered every 5 sec. Three representative current traces are shown for each cell; openings aredownward deflections, and the horizontal lines that run through the traces represent the closed state. Calibration: 1 pA, 250 msec. d, Similar single-channel conductance for VDCCs in PCs of +/+, +/du, and du/du mice using the same symbols as in a. Single-channel amplitudes were measured at three different voltages and averaged for each population.n = 3–4, 4–5, and 2–6 patches for +/+, +/du, and du/du, respectively. The single-channel conductance was determined by fitting a linear function to the mean data and was 13.8, 11.4, and 13 pS, respectively.e, I–V relationships for GCs from +/+ (n = 35), +/du(n = 18), and du/du(n = 23) mice. Cells were held at −70 mV. The meanI–V relationships were fitted with a combined Boltzmann and linear fit. f, Example current traces from +/+, +/du, and du/du GCs. The currents shown were elicited by 100 msec depolarizing voltage steps from −50 to +15 mV. Calibration: 10 pA/pF, 50 msec.

References

    1. Barclay J, Rees M. Genomic organisation of the mouse and human α2δ2 voltage dependent calcium channel subunit genes. Mamm Genome. 2000;11:1142–1144. - PubMed
    1. Berridge MJ, Bootman MD, Lipp P. Calcium: a life and death signal. Nature. 1998;395:645–648. - PubMed
    1. Blatt C, Eversole-Cire P, Cohn VH, Zollman S, Fournier RE, Mohandas LT, Nesbitt M, Lugo T, Jones DT, Reed RR, Weiner LP, Sparkes RS, Simon MI. Chromosomal localization of genes encoding guanine nucleotide-binding protein subunits in mouse and human. Proc Natl Acad Sci USA. 1988;85:7642–7646. - PMC - PubMed
    1. Burgess DL, Jones JM, Meisler MH, Noebels JL. Mutation of the Ca2+ channel β subunit gene Cchb4 is associated with ataxia and seizures in the lethargic (lh) mouse. Cell. 1997;88:385–392. - PubMed
    1. Burgess DL, Biddlecombe GH, McDonough SI, Diaz ME, Zilinski CA, Bean BP, Campbell KP, Noebels JL. Beta subunit reshuffling modifies N- and P/Q-type Ca2+ channel subunit compositions in lethargic mouse brain. Mol Cell Neurosci. 1999;13:293–311. - PubMed

Publication types

MeSH terms

Associated data