. 2001 Aug 15;21(16):6338-47.
doi: 10.1523/JNEUROSCI.21-16-06338.2001.

Preferential increases in nucleus accumbens dopamine after systemic cocaine administration are caused by unique characteristics of dopamine neurotransmission

Affiliations

Preferential increases in nucleus accumbens dopamine after systemic cocaine administration are caused by unique characteristics of dopamine neurotransmission

Q Wu et al. J Neurosci. .

Abstract

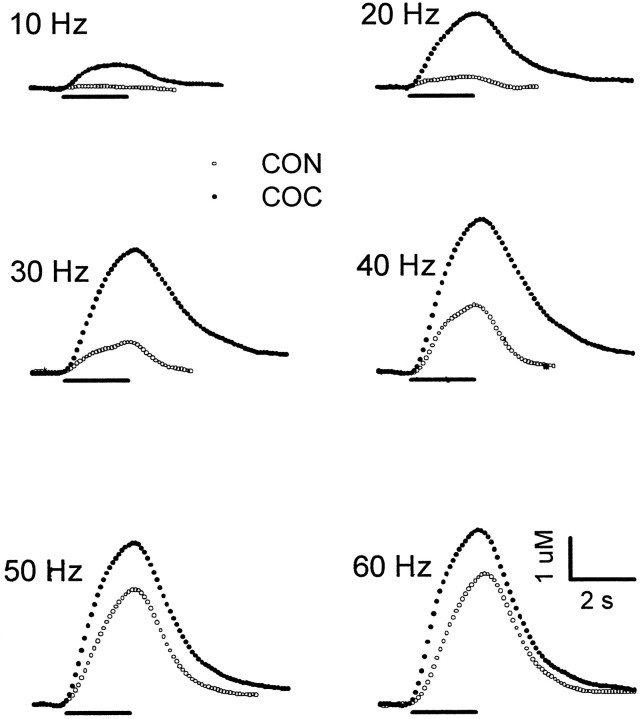
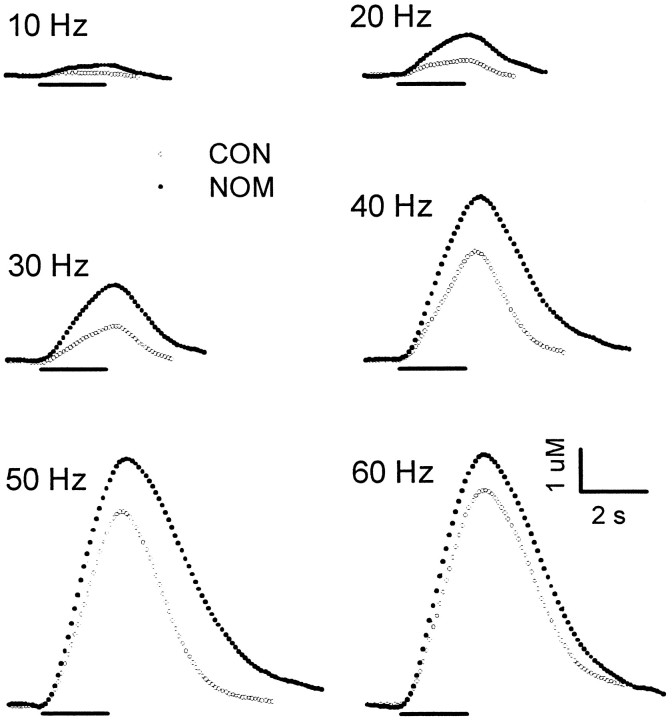
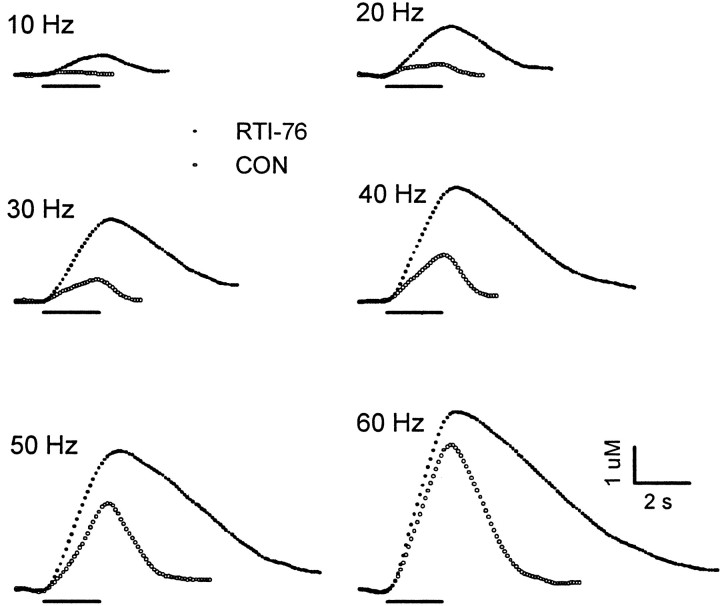
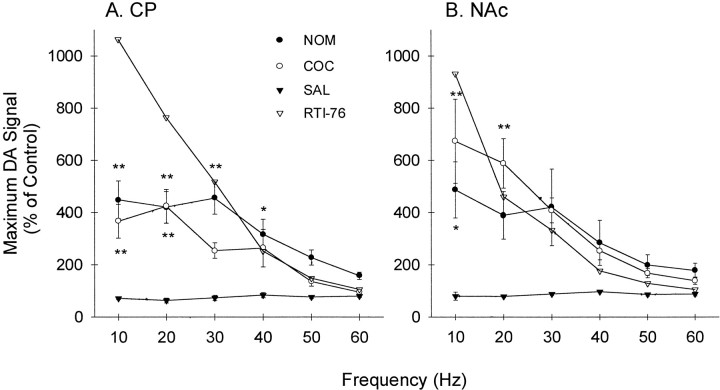
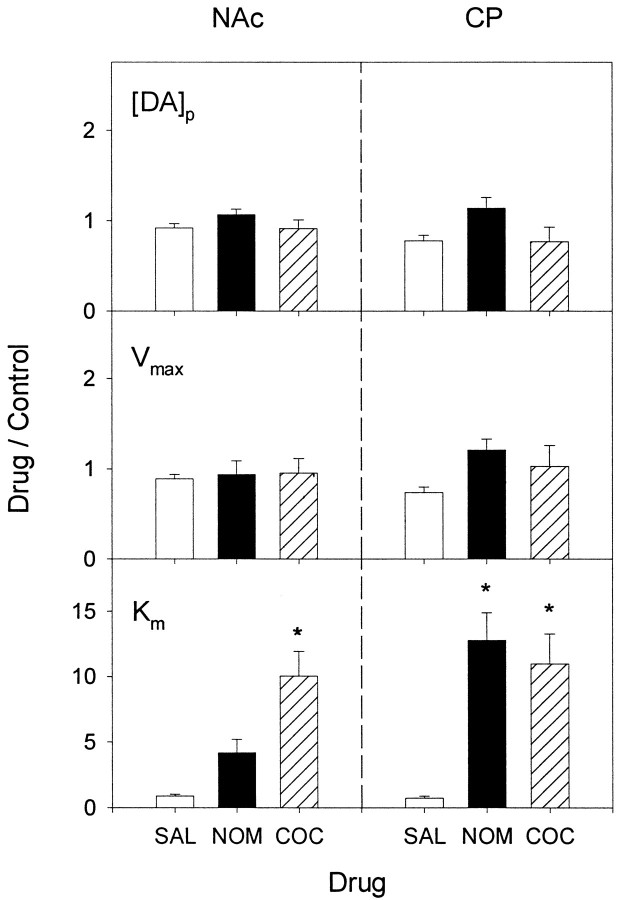
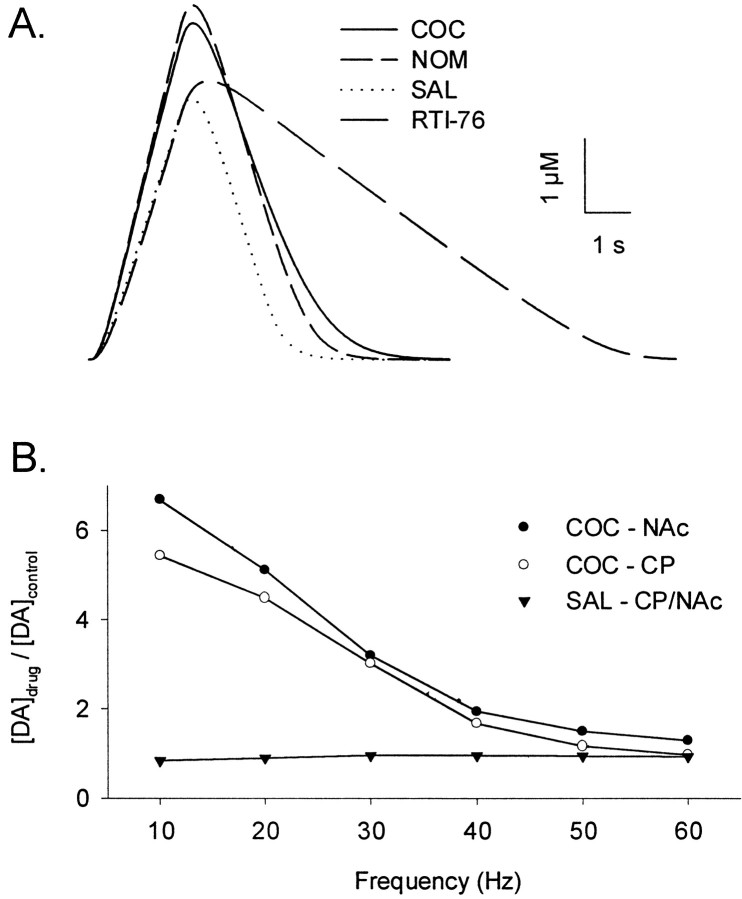
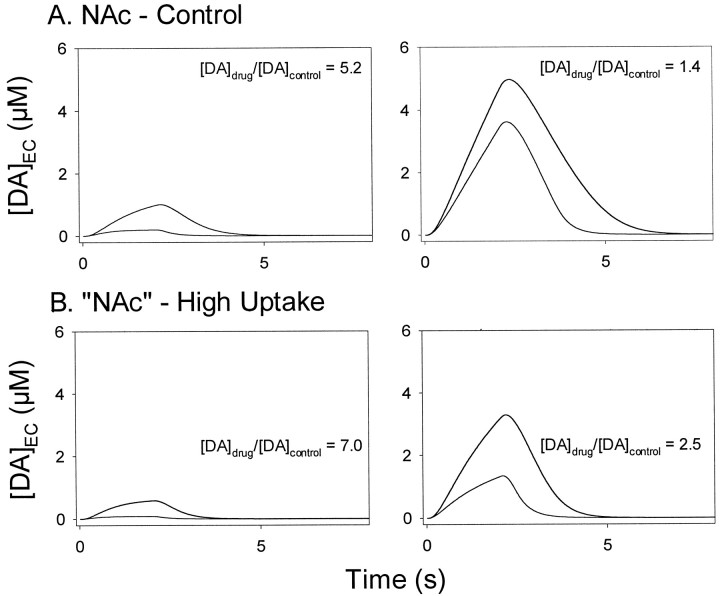
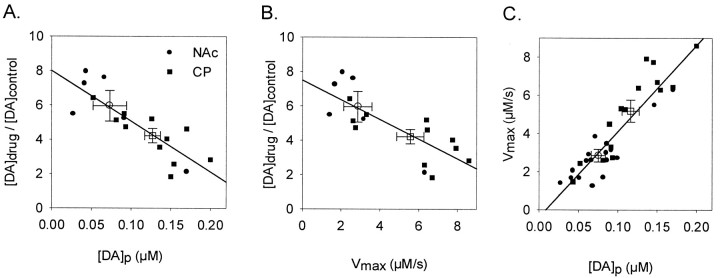
In vivo voltammetry was used to investigate the preferential increase of extracellular dopamine in the nucleus accumbens relative to the caudate-putamen after systemic cocaine administration. In the first part of this study, cocaine (40 mg/kg, i.p.) was compared with two other blockers of dopamine uptake, nomifensine (10 mg/kg, i.p.) and 3beta-(p-chlorophenyl)tropan-2beta-carboxylic acid p-isothiocyanatophenylmethyl ester hydrochloride (RTI-76; 100 nmol, i.c.v.), to assess whether the inhibitory mechanism of cocaine differed in the two regions. All three drugs robustly increased electrically evoked levels of dopamine, and cocaine elevated dopamine signals to a greater extent in the nucleus accumbens. However, kinetic analysis of the evoked dopamine signals indicated that cocaine and nomifensine increased the K(m) for dopamine uptake whereas the dominant effect of RTI-76 was a decrease in V(max). Under the present in vivo conditions, therefore, cocaine is a competitive inhibitor of dopamine uptake in both the nucleus accumbens and caudate-putamen. Whether the preferential effect of cocaine was mediated by regional differences in the presynaptic control of extracellular DA that are described by rates for DA uptake and release was examined next by a correlation analysis. The lower rates for dopamine release and uptake measured in the nucleus accumbens were found to underlie the preferential increase in extracellular dopamine after cocaine. This relationship explains the paradox that cocaine more effectively increases accumbal dopamine despite identical effects on the dopamine transporter in the two regions. The mechanism proposed for the preferential actions of cocaine may also mediate the differential effects of psychostimulant in extrastriatal regions and other uptake inhibitors in the striatum.


Figures

Fig. 1.
Fig. 1.
Effects of cocaine on electrically evoked levels of extracellular DA in the NAc. Changes in the dopamine signal were recorded during the predrug control phase (CON;open circles) and after administration of cocaine (COC; solid circles). All data are from the same animal. After collection of the predrug frequency response, cocaine (40 mg/kg, i.p.) was administered, and beginning 20 min later, a second frequency response using identical stimulus parameters was collected. Single points represent the concentration of DA determined at 100 msec intervals during each voltammogram. Each pair of evoked signals was measured at the same stimulus frequency, shown on the top left of the traces. Thesolid line underneath each pair of recordings demarcates the time and duration of the stimulus train. For comparison, time and concentration scales and presentation of data are identical in this and subsequent figures (see Figs. 2, 3).
Fig. 2.
Fig. 2.
Effects of nomifensine on electrically evoked levels of extracellular DA in the NAc. Changes in the dopamine signal were recorded during the predrug control phase (CON;open circles) and after administration of nomifensine (NOM; solid circles). All data are from the same animal. The experimental design is identical for that used in Figure 1 except that nomifensine (10 mg/kg, i.p.) was administered.
Fig. 3.
Fig. 3.
Effects of RTI-76 on electrically evoked levels of extracellular DA in the NAc. Two sets of evoked signals, recorded in different animals, are shown. The first set oftraces describes changes in the dopamine signal monitored 1 d after intracerebroventricular injection of RTI-76 (100 nmol; solid circles). The second set(CON; open circles) was recorded in a naive rat.
Fig. 4.
Fig. 4.
Average of the effects of uptake inhibitors on extracellular DA in the CP and NAc. The effects of nomifensine (NOM; solid circles), cocaine (COC; open circles), and saline (SAL; solid triangles) are expressed as a percentage of the predrug control and were calculated by dividing the maximal signal evoked in the presence of the inhibitor by the maximal signal measured during the control. After multiplying by 100, values (% of predrug control) were averaged for all animals and expressed as the mean ± SEM (n = 5–7). The effects of RTI-76 (open triangles) were calculated as a percentage of the predrug values averaged for the cocaine, saline, and nomifensine groups. A, B, Data collected in the CP and NAc, respectively. Statistical analysis only applies to the effects of cocaine and nomifensine relative to saline (*p < 0.05; **p < 0.01).
Fig. 5.
Fig. 5.
Analysis of the effects of nomifensine and cocaine on DA release and uptake in the CP and NAc. Recordings describing the effects of cocaine, nomifensine, and saline on electrically evoked levels of DA were kinetically analyzed to determine parameters for DA release and uptake. Resulting changes in [DA]p,Vmax, and Kmare expressed as the ratio of drug to predrug values. All data are the mean ± SEM (n = 5–7). Results in the NAc and CP are shown in left and right panels, respectively (*p < 0.05, compared with SAL in each region). COC, Cocaine;NOM, nomifensine; SAL, saline.
Fig. 6.
Fig. 6.
Simulated effects of uptake inhibitors on extracellular DA in the CP and NAC. To minimize variability in measured DA levels, a single group of control (i.e., predrug) curves was simulated using the average parameters for DA release and uptake found in Table 1. The effects of cocaine, nomifensine, and saline were then simulated after multiplying the control parameters by the ratio of drug to predrug effects found in Figure 5. Because no predrug responses were collected, the effects of RTI-76 were simulated directly using parameters found in Table 2. All simulated curves were calculated from Equations 1 and 2. A, Individual curves simulated for a frequency of 60 Hz in the NAc. The beginning of each curve is the initiation of the stimulus train. B, Simulated frequency responses for the effects of cocaine and saline. Simulated data are expressed as a ratio of drug over control values, identical to that for experimental data in Figure 4. The effects of cocaine are shown for both the NAc (solidcircles;COC–NAc) and CP (open circles;COC–CP). The effects of saline in the two regions were averaged to produce a single frequency response (solid triangles; SAL–CP/NAc). COC, Cocaine; NOM, nomifensine; SAL, saline.
Fig. 7.
Fig. 7.
Theoretical effects of altering theVmax for DA uptake on cocaine-induced increases of extracellular DA in the NAc. Theoretical responses to 20 and 60 Hz stimulation are shown in left and right panels, respectively. Each panel contains two sets of curves, one for predrug control and the other for cocaine. In all panels the curve with the higher amplitude is the cocaine curve. The ratio of drug over control for maximal levels of extracellular DA, calculated as in Figure 4, is shown in eachpanel([DA]drug/[DA]control). All curves were calculated from Equations 1 and 2. A, The simulated effects of cocaine in the NAc. B, The theoretical effects of cocaine in the “NAc” when theVmax for DA uptake is increased to resemble that of the CP. EC, Extracellular.
Fig. 8.
Fig. 8.
A, B, Functional relationships between the effects of uptake inhibition on extracellular DA and [DA]p or Vmax, respectively. Data are from the 17 animals in which the effects of cocaine in the CP and NAc and nomifensine in the NAc were analyzed. Increases in DA levels after administration of uptake inhibitors are expressed as the ratio of drug over control and calculated for a frequency of 20 Hz. C, The functional relationship between [DA]p and Vmax. Data are from 31 animals and represent all predrug data found in this study. In all panels, solid symbols are individual values, and open symbols are average values (error bars indicate SEM). Squares and circlesrepresent data in the CP and NAc, respectively. Solid lines were calculated by linear regression.

Similar articles

Cited by

References

    1. Bergstrom BP, Garris PA. Utility of a tripolar stimulating electrode for eliciting dopamine release in the rat striatum. J Neurosci Methods. 1999;87:201–208. - PubMed
    1. Bjorklund A, Lindvall O. Dopamine-containing systems in the CNS. In: Bjorklund A, Hokfelt T, editors. Handbook of chemical neuroanatomy. Elsevier; New York: 1984. pp. 55–122.
    1. Boja JW, Kuhar MJ. [3H]cocaine binding and inhibition of [3H]dopamine uptake is similar in both the rat striatum and nucleus accumbens. Eur J Pharmacol. 1989;173:215–217. - PubMed
    1. Bradberry CW, Barrett-Larimore RL, Jatlow P, Rubino SR. Impact of self-administered cocaine and cocaine cues on extracellular dopamine in mesolimbic and sensorimotor striatum in rhesus monkeys. J Neurosci. 2000;20:3874–3883. - PMC - PubMed
    1. Cahill PS, Walker QD, Finnegan JM, Mickelson GE, Travis ER, Wightman RM. Microelectrodes for the measurement of catecholamines in biological systems. Anal Chem. 1996;68:3180–3186. - PubMed

Publication types

MeSH terms

LinkOut - more resources