. 2001 Aug;13(8):1791-802.
doi: 10.1105/tpc.010020.

Expression of Arabidopsis GAI in transgenic rice represses multiple gibberellin responses

Affiliations

Expression of Arabidopsis GAI in transgenic rice represses multiple gibberellin responses

X Fu et al. Plant Cell. 2001 Aug.

Abstract

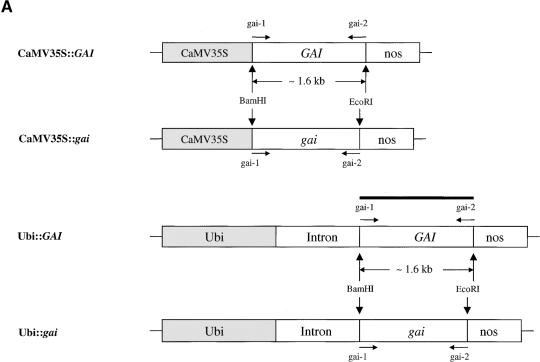
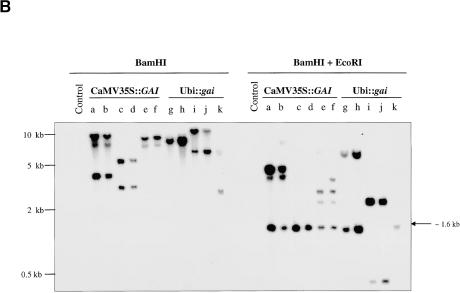
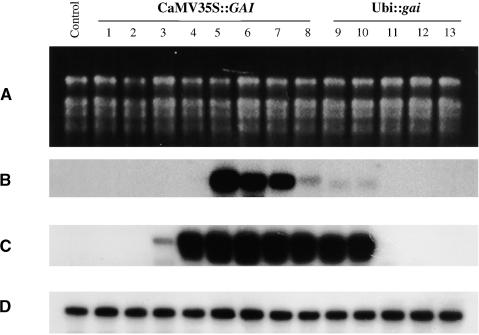
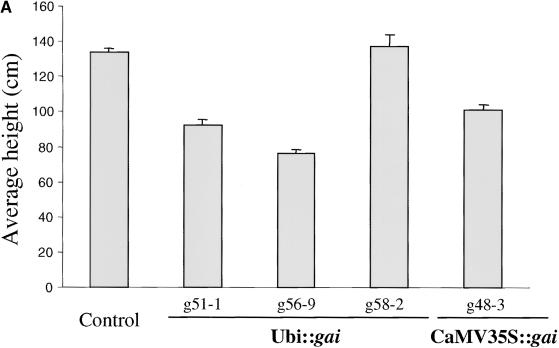
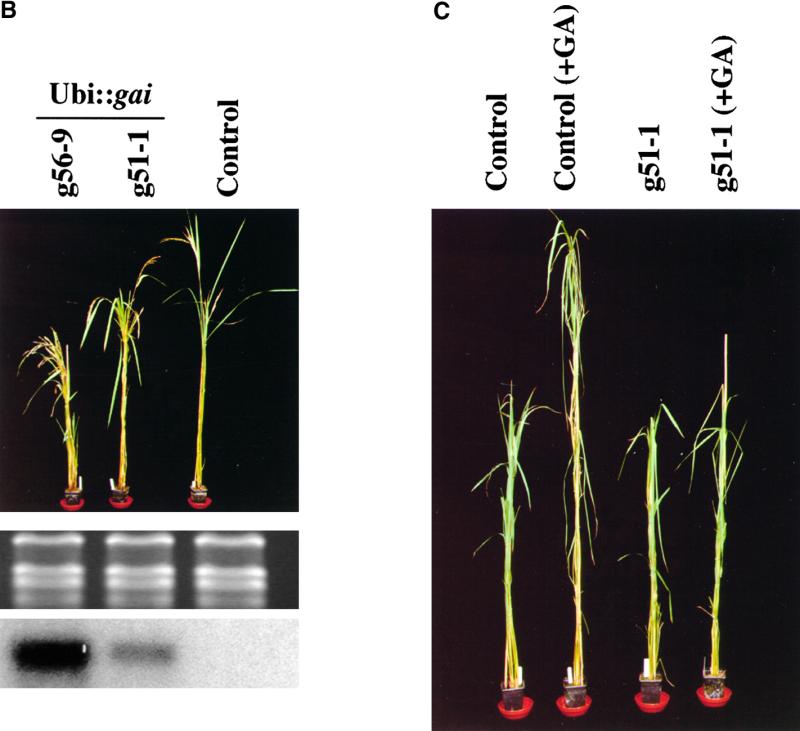
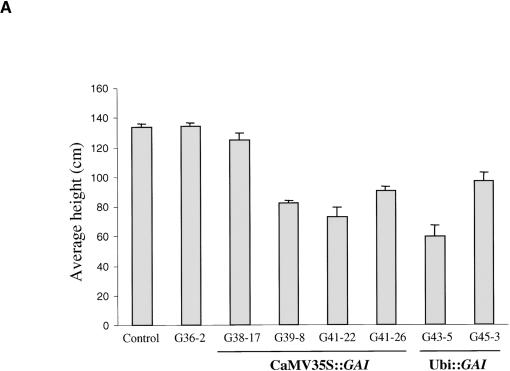
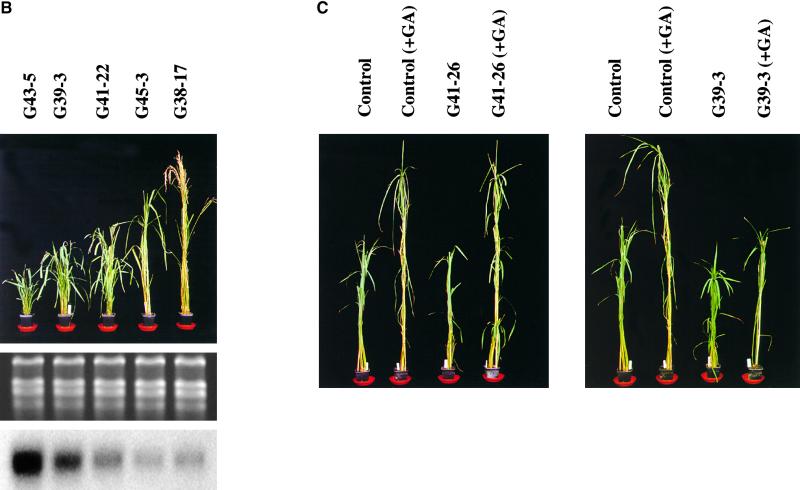
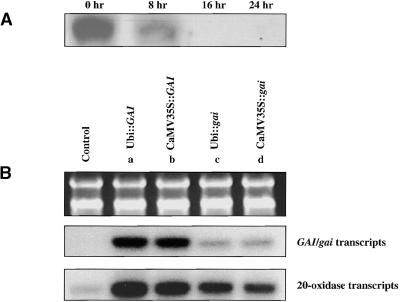
Bioactive gibberellins (GAs) are essential endogenous regulators of plant growth. GA signaling is mediated via GAI, a nuclear member of the GRAS family of plant transcription factors. Previous experiments have suggested that GAI is a GA-derepressible repressor of plant growth. Here we test this hypothesis by examining the effects of the expression of Arabidopsis GAI in transgenic Basmati rice. High-level expression of GAI caused dwarfism and reduced GA responses, and the strength of this effect was correlated with the level of transgene expression. In particular, the expression of GAI abolished the GA-mediated induction of rice aleurone alpha-amylase activity, thus implicating GAI orthologs in the well-characterized cereal aleurone GA response. The GA derepressible repressor model predicts that high-level expression of GAI should confer dwarfism, and these observations are consistent with this prediction.


Figures

Figure 1.
Figure 1.
Generation and Preliminary Characterization of Transgenic Rice Plants Expressing Arabidopsis GAI or gai. (A) Maps of the constructs showing transcription units, relevant restriction sites, and primers used for PCR and RT-PCR (arrows). The GAI and gai ORFs are ∼1.6 kb in size; the gai ORF is slightly smaller than the GAI ORF as a result of its characteristic 51-bp internal deletion (Peng et al., 1997). nos, nopaline synthase. Bar represents hybridization probe used in (B). (B) DNA gel blot analysis of R1 transgenic plants after digestion of genomic DNA with BamHI or with BamHI and EcoRI using a radiolabeled Arabidopsis GAI ORF as probe. There is no detectable hybridization of the probe to digests of DNA from untransformed Basmati rice plants (Control). Plants were G38-4 (a), G38-17 (b), G39-3 (c), G39-8 (d), G41-22 (e), G41-26 (f), g51-1 (g), g51-6 (h), g58-1 (i), g58-2 (j), and g59-1 (k). The arrow marks the position of the intact ∼1.6-kb ORF.
Figure 1.
Figure 1.
Generation and Preliminary Characterization of Transgenic Rice Plants Expressing Arabidopsis GAI or gai. (A) Maps of the constructs showing transcription units, relevant restriction sites, and primers used for PCR and RT-PCR (arrows). The GAI and gai ORFs are ∼1.6 kb in size; the gai ORF is slightly smaller than the GAI ORF as a result of its characteristic 51-bp internal deletion (Peng et al., 1997). nos, nopaline synthase. Bar represents hybridization probe used in (B). (B) DNA gel blot analysis of R1 transgenic plants after digestion of genomic DNA with BamHI or with BamHI and EcoRI using a radiolabeled Arabidopsis GAI ORF as probe. There is no detectable hybridization of the probe to digests of DNA from untransformed Basmati rice plants (Control). Plants were G38-4 (a), G38-17 (b), G39-3 (c), G39-8 (d), G41-22 (e), G41-26 (f), g51-1 (g), g51-6 (h), g58-1 (i), g58-2 (j), and g59-1 (k). The arrow marks the position of the intact ∼1.6-kb ORF.
Figure 2.
Figure 2.
RNA Gel Blot and RT-PCR Analyses of the Expression of GAI or gai Transcripts in Transgenic Rice. (A) UV fluorescence of ethidium bromide–stained gel containing RNA from plants (nontransgenic control and 1, G36-1; 2, G36-2; 3, G38-4; 4, G38-17; 5, G39-3; 6, G39-8; 7, G41-22; 8, G41-26; 9, g51-1; 10, g51-6; 11, g58-1; 12, g58-2; and 13, g59-1) used for the hybridization shown in (B). (B) RNA gel blot analysis of RNA shown in (A) using a radiolabeled GAI ORF as probe. (C) RT-PCR analysis of GAI/gai transcript levels in RNA from R1 plants. RT-PCR amplification was for 25 cycles using the gai-1 and gai-2 primers (see Methods and Figure 1A). (D) RT-PCR control showing that actin transcripts are detected consistently in all of the samples used for the GAI/gai RT-PCR experiment shown in (C).
Figure 3.
Figure 3.
Phenotypic Analysis of Transgenic Basmati Rice Plants Expressing gai. (A) Histogram showing heights of 2-month-old R2 plants. Mean heights (error bars represent ±se) of 20 plants derived from self-pollination of R1 plants g51-1, g56-9, g58-2, g48-3, and control (untransformed) Basmati 370 rice plants are shown. (B) Five-month-old plants derived from self-pollination of g56-9, g51-1, and control (untransformed) Basmati 370 rice plants. Beneath the plants, the UV fluorescence of an ethidium bromide–stained gel containing RNA prepared from each plant is shown. Beneath the UV fluorescence, an RNA gel blot hybridization from this gel, using a radiolabeled GAI ORF probe, is shown. (C) Responses to GA treatment in Ubi::gai plants. Two-month-old R2 plants derived from self-pollination of g51-1 were sprayed with 100 μM GA3 (+GA) or water once per day for 1 week and photographed 1 week after the final sprays.
Figure 3.
Figure 3.
Phenotypic Analysis of Transgenic Basmati Rice Plants Expressing gai. (A) Histogram showing heights of 2-month-old R2 plants. Mean heights (error bars represent ±se) of 20 plants derived from self-pollination of R1 plants g51-1, g56-9, g58-2, g48-3, and control (untransformed) Basmati 370 rice plants are shown. (B) Five-month-old plants derived from self-pollination of g56-9, g51-1, and control (untransformed) Basmati 370 rice plants. Beneath the plants, the UV fluorescence of an ethidium bromide–stained gel containing RNA prepared from each plant is shown. Beneath the UV fluorescence, an RNA gel blot hybridization from this gel, using a radiolabeled GAI ORF probe, is shown. (C) Responses to GA treatment in Ubi::gai plants. Two-month-old R2 plants derived from self-pollination of g51-1 were sprayed with 100 μM GA3 (+GA) or water once per day for 1 week and photographed 1 week after the final sprays.
Figure 4.
Figure 4.
Phenotypic Analysis of Transgenic Basmati Rice Plants Expressing GAI. (A) Histogram showing mean heights of 2-month-old R2 plants. Mean heights (error bars represent ±se) of 20 plants derived from self-pollination of a control plant and of plants G36-2, G38-17, G39-8, G41-22, G41-26, G43-5, and G45-3. (B) Five-month-old R2 plants expressing GAI and derived from R1 plants G43-5, G39-3, G41-22, G45-3, and G38-17. Beneath the plants, the UV fluorescence of an ethidium bromide–stained gel containing RNA prepared from each plant is shown. Beneath the UV fluorescence, RNA gel blot hybridization of RNA from this gel, using a radiolabeled GAI ORF probe, reveals a range of GAI transcript levels. (C) Responses to GA treatment in R2 plants derived from plant G41-26 (homozygous for a CaMV35S::GAI transgene and containing relatively low GAI mRNA levels) and from plant G39-3 (homozygous for a CaMV35S::GAI transgene and containing relatively high levels of GAI mRNA). The 2-month-old plants were sprayed with 100 μM GA3 (+GA) or water once per day for 1 week and photographed 1 week after the final sprays.
Figure 4.
Figure 4.
Phenotypic Analysis of Transgenic Basmati Rice Plants Expressing GAI. (A) Histogram showing mean heights of 2-month-old R2 plants. Mean heights (error bars represent ±se) of 20 plants derived from self-pollination of a control plant and of plants G36-2, G38-17, G39-8, G41-22, G41-26, G43-5, and G45-3. (B) Five-month-old R2 plants expressing GAI and derived from R1 plants G43-5, G39-3, G41-22, G45-3, and G38-17. Beneath the plants, the UV fluorescence of an ethidium bromide–stained gel containing RNA prepared from each plant is shown. Beneath the UV fluorescence, RNA gel blot hybridization of RNA from this gel, using a radiolabeled GAI ORF probe, reveals a range of GAI transcript levels. (C) Responses to GA treatment in R2 plants derived from plant G41-26 (homozygous for a CaMV35S::GAI transgene and containing relatively low GAI mRNA levels) and from plant G39-3 (homozygous for a CaMV35S::GAI transgene and containing relatively high levels of GAI mRNA). The 2-month-old plants were sprayed with 100 μM GA3 (+GA) or water once per day for 1 week and photographed 1 week after the final sprays.
Figure 5.
Figure 5.
Rice 20-Oxidase Transcripts Are Upregulated by Expression of GAI or gai. (A) RNA gel blot analysis of 20-oxidase transcripts in GA-treated Basmati rice seedlings. One-week-old seedlings were sprayed with 100 μM GA3. Leaf RNA samples were prepared 8, 16, and 24 hr after treatment. (B) The relationship between 20-oxidase and gai/GAI transcripts in transgenic rice plants. Top, UV fluorescence of an ethidium bromide–stained gel containing RNA prepared from plants G43-5 (a), G39-8 (b), g51-1 (c), g48-3 (d), and a control, untransformed Basmati rice plant. Beneath the UV fluorescence is an RNA gel blot hybridization from this gel, using a radiolabeled GAI ORF probe. Beneath this is shown a further hybridization, using a radiolabeled 20-oxidase probe.

References

    1. Bethke, P.C., Schuurink, R., and Jones, R.L. (1997). Hormonal signalling in cereal aleurone. J. Exp. Bot. 48, 1337–1356.
    1. Börner, A., Plaschke, J., Korzun, V., and Worland, A.J. (1996). The relationships between the dwarfing genes of wheat and rye. Euphytica 89, 69–75.
    1. Chiang, H.-H., Hwang, I., and Goodman, H.M. (1995). Isolation of the Arabidopsis GA4 locus. Plant Cell 7, 195–201. - PMC - PubMed
    1. Christou, P., Ford, T.L., and Kofron, M. (1991). Genotype-independent stable transformation of rice (Oryza sativa) plants. Bio/Technology 9, 957–962.
    1. Cowling, R.J., Kamiya, Y., Seto, H., and Harberd, N.P. (1998). Gibberellin dose-response regulation of GA4 gene transcript levels in Arabidopsis. Plant Physiol. 117, 1195–1203. - PMC - PubMed

Publication types

MeSH terms