. 2001 Aug 6;194(3):275-84.
doi: 10.1084/jem.194.3.275.

p62(dok), a negative regulator of Ras and mitogen-activated protein kinase (MAPK) activity, opposes leukemogenesis by p210(bcr-abl)

Affiliations

p62(dok), a negative regulator of Ras and mitogen-activated protein kinase (MAPK) activity, opposes leukemogenesis by p210(bcr-abl)

A Di Cristofano et al. J Exp Med. .

Abstract

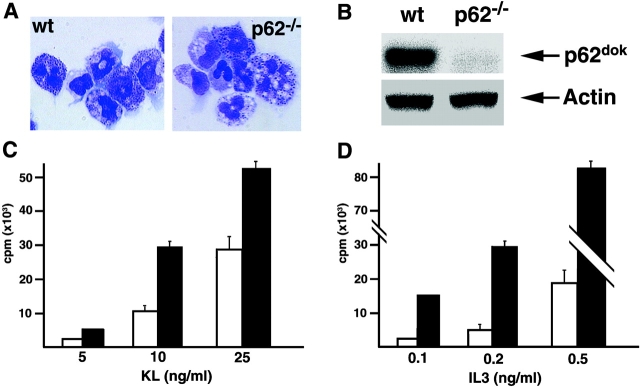
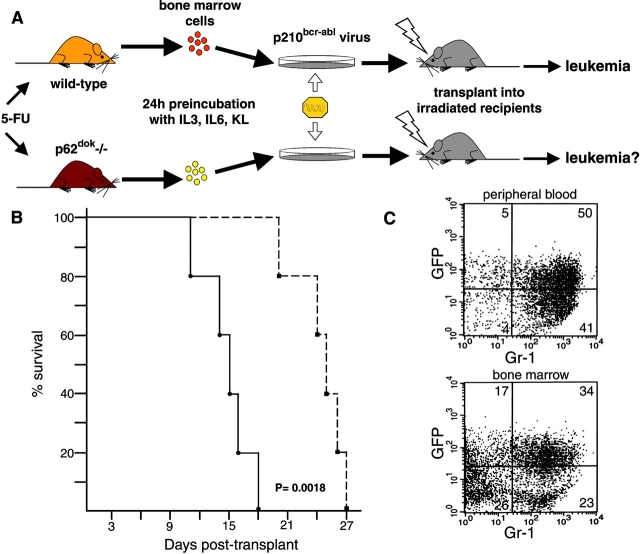
p62(dok) has been identified as a substrate of many oncogenic tyrosine kinases such as the chronic myelogenous leukemia (CML) chimeric p210(bcr-abl) oncoprotein. It is also phosphorylated upon activation of many receptors and cytoplamic tyrosine kinases. However, the biological functions of p62(dok) in normal cell signaling as well as in p210(bcr-abl) leukemogenesis are as yet not fully understood. Here we show, in hemopoietic and nonhemopoietic cells derived from p62(dok)-(/)- mice, that the loss of p62(dok) results in increased cell proliferation upon growth factor treatment. Moreover, Ras and mitogen-activated protein kinase (MAPK) activation is markedly sustained in p62(dok)-(/)- cells after the removal of growth factor. However, p62(dok) inactivation does not affect DNA damage and growth factor deprivation-induced apoptosis. Furthermore, p62(dok) inactivation causes a significant shortening in the latency of the fatal myeloproliferative disease induced by retroviral-mediated transduction of p210(bcr-abl) in bone marrow cells. These data indicate that p62(dok) acts as a negative regulator of growth factor-induced cell proliferation, at least in part through downregulating Ras/MAPK signaling pathway, and that p62(dok) can oppose leukemogenesis by p210(bcr-abl).


Figures

Figure 1
Figure 1
Targeted disruption of the p62dok gene. (A) Structure of the p62dok gene (top), the targeting construct (center), and the predicted structure of the disrupted p62dokgene after homologous recombination (bottom). Only the relevant restriction sites are shown: B, BamH1; H2, HindII; R, EcoR1; H3, HindIII. The numbered solid boxes represent the exons. Neo and TK (herpes simplex virus thymidine kinase) refer to the positive and negative selection markers, respectively. The genomic fragments used as probes for Southern blot analysis are indicated, as well as the expected fragments after hybridization with the two probes, upon digestion with BamH1 and HindIII. (B) Southern blot analysis of ES cells clones after digestion with Hind III and hybridization with the 3′ external probe. (C) Southern blot analysis of BamH1-digested genomic DNA from F2 mice resulting from a cross between two p62dok +/− mice. The blot was hybridized with the 5′ probe. (D) Western blot analysis of thymus and spleen from wild-type and p62dok/− mice, showing the absence of p62dok.
Figure 2
Figure 2
Effect of p62dok disruption on BMMCs proliferation. (A) Morphology of wild-type (wt) and p62dok/− BMMCs. (B) Expression of p62dok and actin detected by Western blot analysis in protein extracts (60 μg) from BMMCs. (C and D) Proliferative response, determined as [3H]thymidine incorporation, of wild-type and p62dok/− BMMCs upon KL and IL-3 stimulation. Wild-type, white bar; p62dok/−, black bar. All graphs are representative of experiments repeated three to five times. Error bars represent standard deviation.
Figure 4
Figure 4
Effect of p62dok disruption on growth factor deprivation and DNA damage–induced apoptosis. (A) Kinetics of the apoptotic response to IL-3 deprivation in BMMCs. Cell death was analyzed by annexin V staining of wild-type (filled square) and p62dok/− (filled circle) cells at the indicated time points after IL-3 withdrawal (solid lines) or in the presence of IL-3 as a control (dashed lines). (B) In vivo apoptotic response to irradiation. Mice were irradiated (10 Gy) and killed after 6 h. Cell death was analyzed by annexin V staining of bone marrow cells (BM) and thymocytes (Thy). The percent of spontaneous apoptosis in unirradiated littermates has been subtracted from the values shown in the graph. Wild-type, black bar; p62dok/−, gray bar.
Figure 3
Figure 3
Effect of p62dok disruption on cell proliferation in thymocytes, total bone marrow cells and PEFs. (A and B) Proliferative response, determined as [3H]thymidine incorporation, of wild-type and p62dok/− thymocytes upon plate-bound αCD3ε and ConA (3 μg/ml) stimulation, in the presence of IL-2 (100 U/ml). Wild-type, black bar; p62dok/−, gray bar. (C) Proliferation of wild-type and p62dok/− thymocytes upon increasing concentrations of ConA and constant amount of IL-2 (100 U/ml). Wild-type, filled square and dashed line; p62dok/−, filled circle and solid line. (D) Phosphorylation of p62dok upon ConA stimulation. (E) In vitro proliferation of wild-type and p62dok/− bone marrow cells in serum-free medium, in the presence of 10 ng/ml IL-3, measured by manual cell counting. Wild-type, filled square and dashed line; p62dok/−, filled circle and solid line. (F) Proliferative response, determined as [3H]thymidine incorporation, of wild-type and p62dok/− PEFs upon PDGF stimulation. Wild-type, black bar; p62dok/−, gray bar. All graphs are representative of experiments repeated three to five times. Error bars represent standard deviation.
Figure 5
Figure 5
p62dok controls MAPK and ras activation. (A and B) Phosphorylation of p62dok (indicated by an asterisk) and ERK1/2 in response to PDGF. PEF were serum starved and then stimulated with 50 ng/ml PDGF for 10 min. Then, the cells were washed and serum-free medium was added to analyze the kinetics of ERK inactivation. The amount of cell extracts was normalized using an antibody recognizing ERK1/2 independently of its phosphorylation status. Normalized densitometric analysis of ERK1/2 phosphorylation is shown in B. (C) Ras GTP/GDP binding analysis. Wild-type and p62dok/− PEFs were serum starved, labeled with 32Pi for 18 h, and treated with 50 ng/ml PDGF for 10 min. Then the cells were washed twice and incubated in phosphate-free and serum-free medium for additional 15 and 30 min. Cells at different indicated time points were lysed, ras was immunoprecipitated, and the GTP and GDP present in the immunoprecipitates were resolved on a thin-layer polyethyleneimine-cellulose plate. The radioactivity in the GTP and GDP was quantitated with a Fuji Photo Film Co., BAS2000 PhosphorImager. The data are expressed as percent GTP, which was calculated by valueGTP /(1.5 × valueGDP + valueGTP) × 100. Wild-type, filled circle and dashed line; p62dok/−, filled diamond and solid line (D and E). Phosphorylation of ERK1/2 in BMMCs in response to IL-3. BMMCs were serum starved and then stimulated with 2.5 ng/ml IL-3 for 5 min. Then, the cells were washed and serum-free medium was added to analyze the kinetics of ERK inactivation. The amount of cell extracts was normalized using an antibody recognizing ERK1/2 independently of its phosphorylation status. Normalized densitometric analysis of ERK1/2 phosphorylation is shown in E. All graphs are representative examples of experiments repeated three to five times.
Figure 5
Figure 5
p62dok controls MAPK and ras activation. (A and B) Phosphorylation of p62dok (indicated by an asterisk) and ERK1/2 in response to PDGF. PEF were serum starved and then stimulated with 50 ng/ml PDGF for 10 min. Then, the cells were washed and serum-free medium was added to analyze the kinetics of ERK inactivation. The amount of cell extracts was normalized using an antibody recognizing ERK1/2 independently of its phosphorylation status. Normalized densitometric analysis of ERK1/2 phosphorylation is shown in B. (C) Ras GTP/GDP binding analysis. Wild-type and p62dok/− PEFs were serum starved, labeled with 32Pi for 18 h, and treated with 50 ng/ml PDGF for 10 min. Then the cells were washed twice and incubated in phosphate-free and serum-free medium for additional 15 and 30 min. Cells at different indicated time points were lysed, ras was immunoprecipitated, and the GTP and GDP present in the immunoprecipitates were resolved on a thin-layer polyethyleneimine-cellulose plate. The radioactivity in the GTP and GDP was quantitated with a Fuji Photo Film Co., BAS2000 PhosphorImager. The data are expressed as percent GTP, which was calculated by valueGTP /(1.5 × valueGDP + valueGTP) × 100. Wild-type, filled circle and dashed line; p62dok/−, filled diamond and solid line (D and E). Phosphorylation of ERK1/2 in BMMCs in response to IL-3. BMMCs were serum starved and then stimulated with 2.5 ng/ml IL-3 for 5 min. Then, the cells were washed and serum-free medium was added to analyze the kinetics of ERK inactivation. The amount of cell extracts was normalized using an antibody recognizing ERK1/2 independently of its phosphorylation status. Normalized densitometric analysis of ERK1/2 phosphorylation is shown in E. All graphs are representative examples of experiments repeated three to five times.
Figure 6
Figure 6
Retroviral transduction of p210bcr-abl results in the transformation of p62dok/− bone marrow cells. (A) Schematic representation of the protocol for retroviral transduction of bone marrow and subsequent reconstitution into lethally irradiated recipients (reference 27). (B) Survival of 129/Sv wild-type mice receiving transduced bone marrow cells derived from wild-type (filled square and dashed line) and p62dok/− (filled circle and solid line) mice. Log rank statistical analysis was performed to obtain P. (C) Flow cytometric analysis of peripheral blood (top), and bone marrow cells (bottom), from a mouse transplanted with p210bcr-abl transduced p62dok/− bone marrow cells, using a granulocyte surface marker (Gr-1). In the peripheral blood, almost all the infected cells (cells expressing GFP) coexpress the myeloid-specific marker. In the bone marrow, ∼50% of the cells express GFP and >60% of these are Gr-1 positive. A similar immunophenotypical pattern was observed in mice transplanted with wild-type–derived bone marrow (not shown).

References

    1. de Klein A., van Kessel A.G., Grosveld G., Bartram C.R., Hagemeijer A., Bootsma D., Spurr N.K., Heisterkamp N., Groffen J., Stephenson J.R. A cellular oncogene is translocated to the Philadelphia chromosome in chronic myelocytic leukaemia. Nature. 1982;300:765–767. - PubMed
    1. Lugo T.G., Pendergast A.M., Muller A.J., Witte O.N. Tyrosine kinase activity and transformation potency of bcr-abl oncogene products. Science. 1990;247:1079–1082. - PubMed
    1. Clarkson B., Strife A. Linkage of proliferative and maturational abnormalities in chronic myelogenous leukemia and relevance to treatment. Leukemia. 1993;7:1683–1721. - PubMed
    1. Carpino N., Wisniewski D., Strife A., Marshak D., Kobayashi R., Stillman B., Clarkson B. p62(dok)a constitutively tyrosine-phosphorylated, GAP-associated protein in chronic myelogenous leukemia progenitor cells. Cell. 1997;88:197–204. - PubMed
    1. Yamanashi Y., Baltimore D. Identification of the Abl- and rasGAP-associated 62 kDa protein as a docking protein, Dok. Cell. 1997;88:205–211. - PubMed

Publication types

MeSH terms