. 2001 Aug 15;123(32):7804-20.
doi: 10.1021/ja004307+.

Absence of Mn-centered oxidation in the S(2) --> S(3) transition: implications for the mechanism of photosynthetic water oxidation

Affiliations

Absence of Mn-centered oxidation in the S(2) --> S(3) transition: implications for the mechanism of photosynthetic water oxidation

J Messinger et al. J Am Chem Soc. .

Abstract

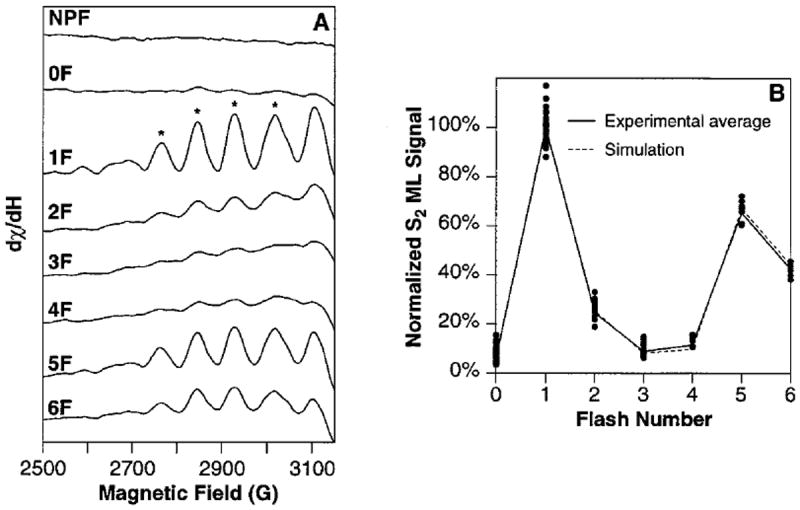
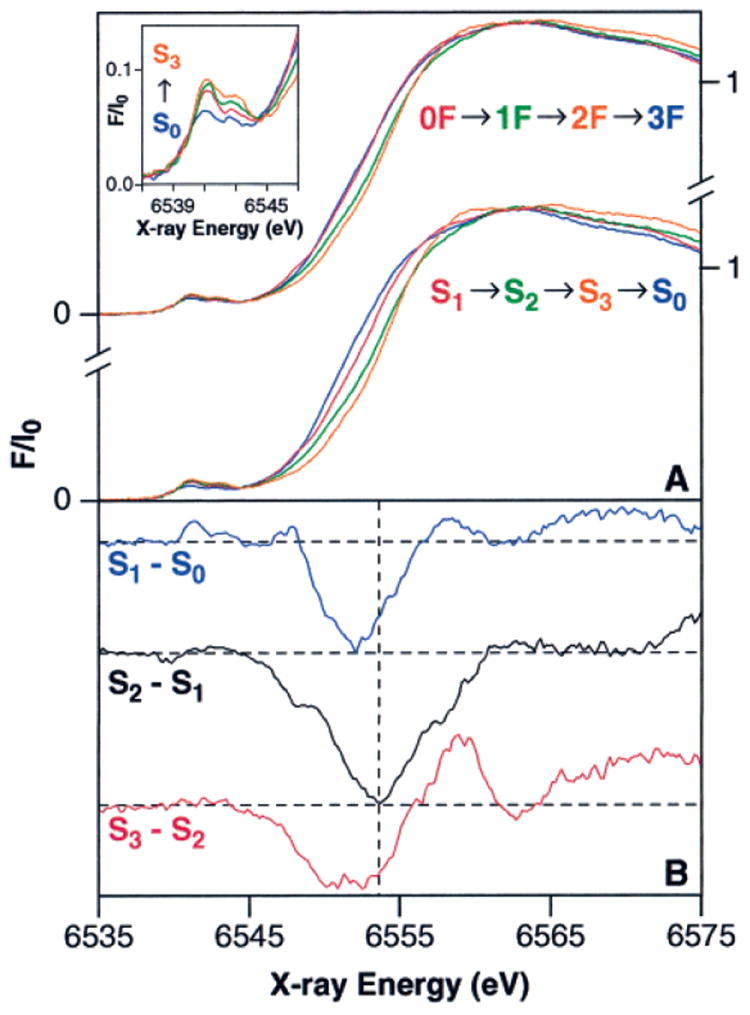
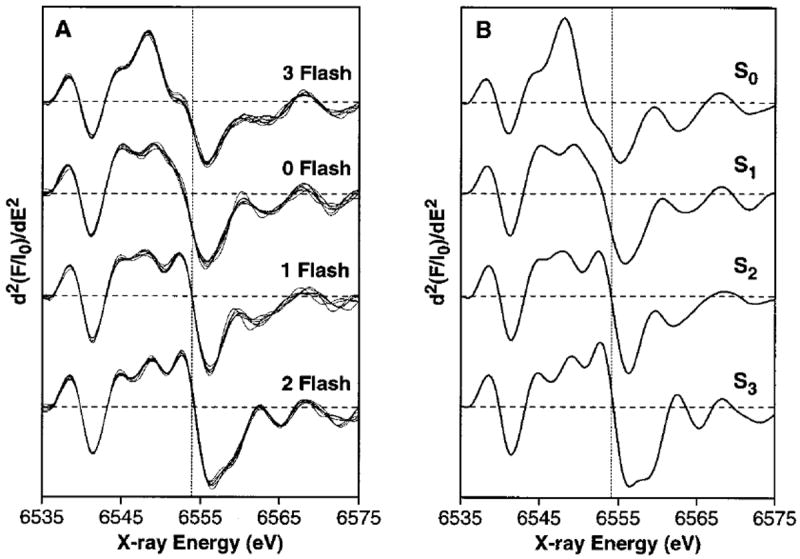
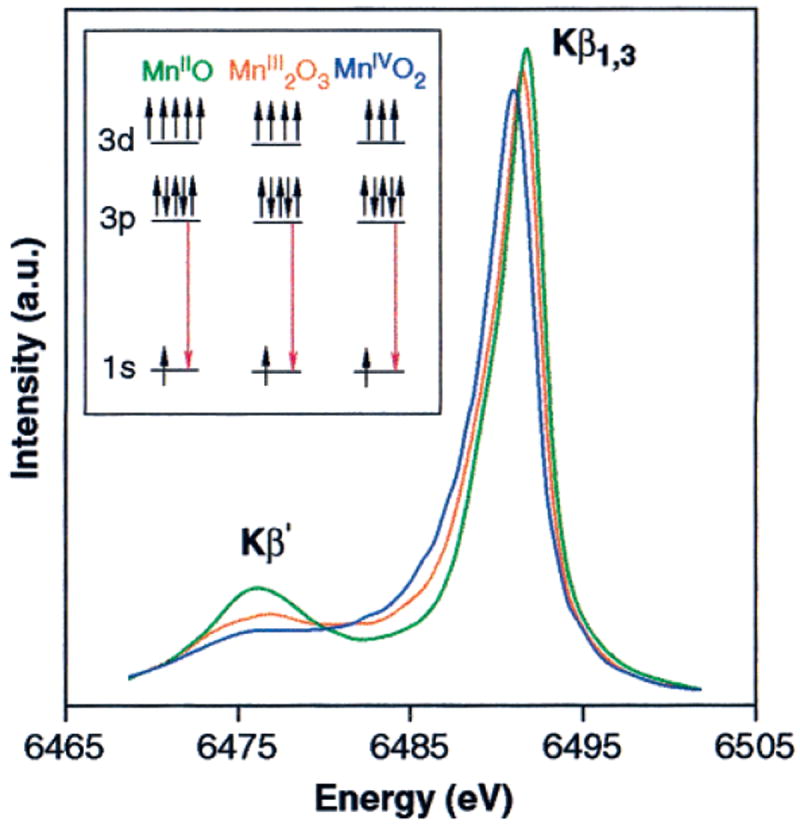
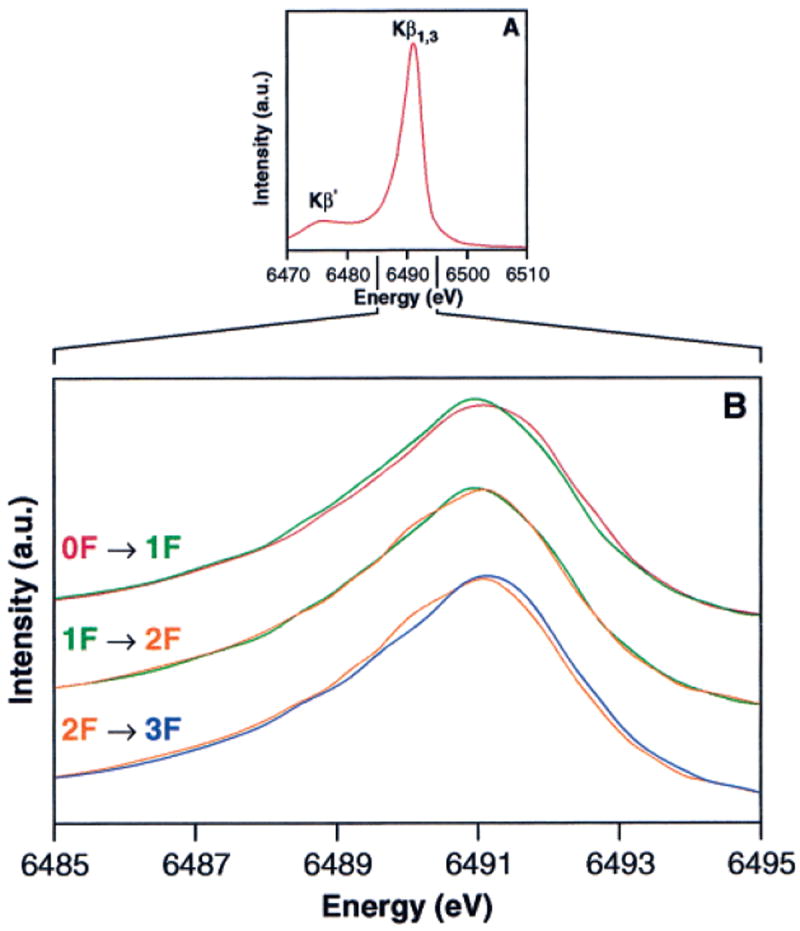
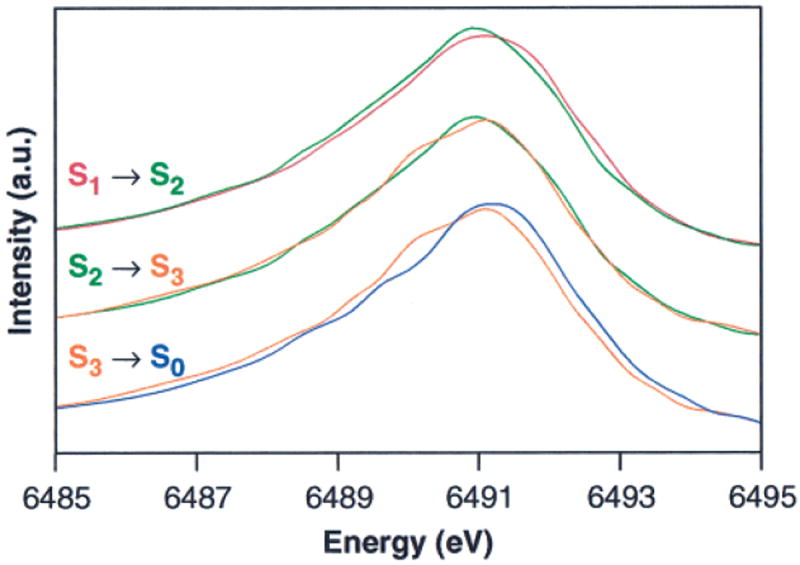
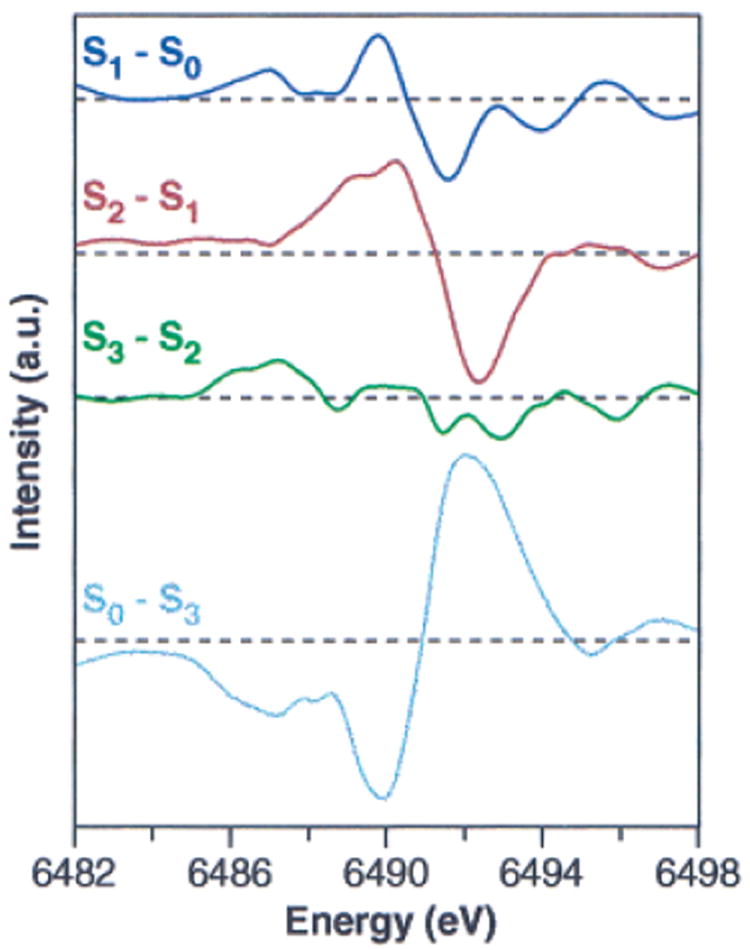
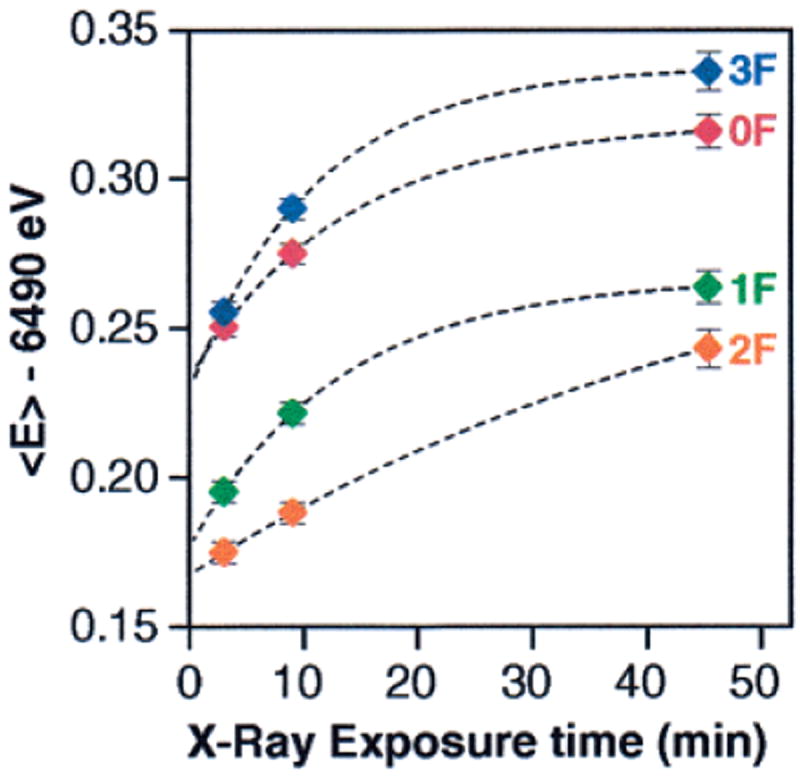
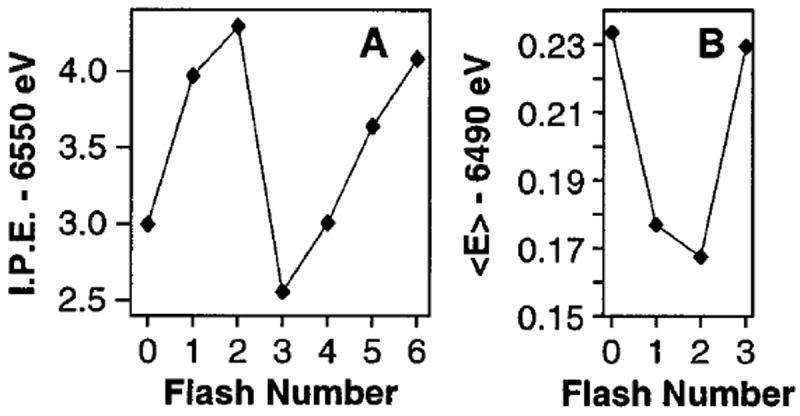
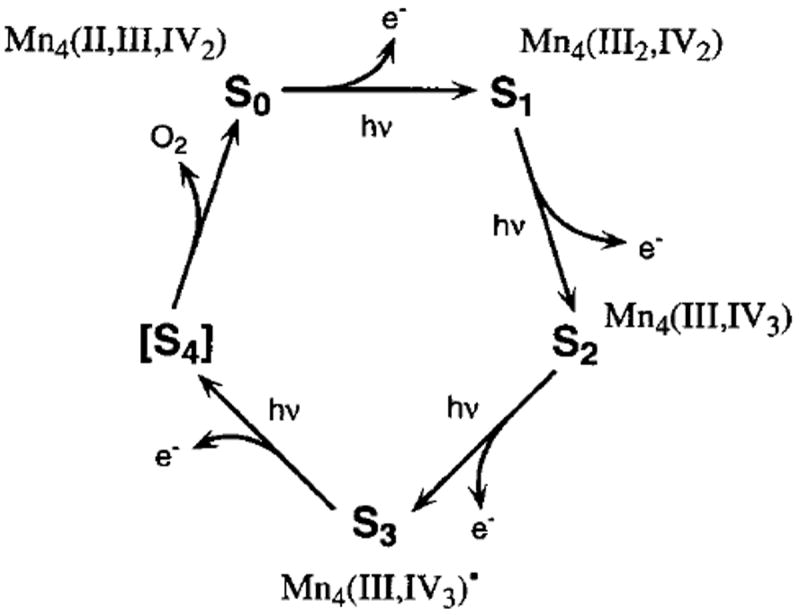
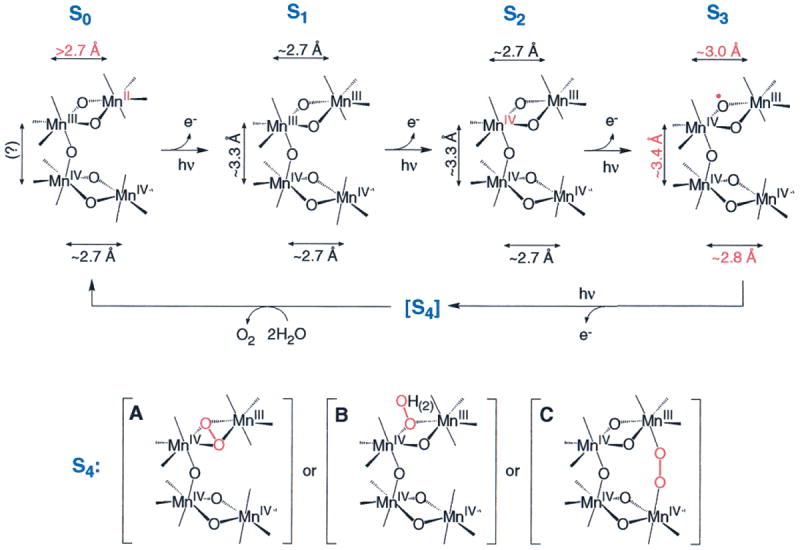
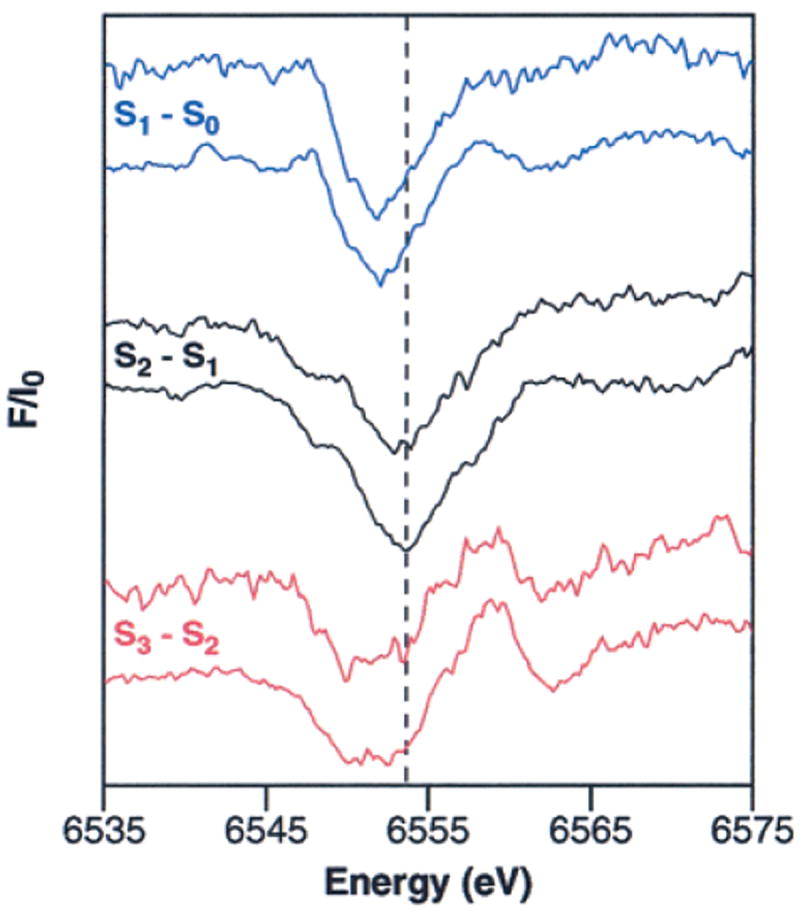
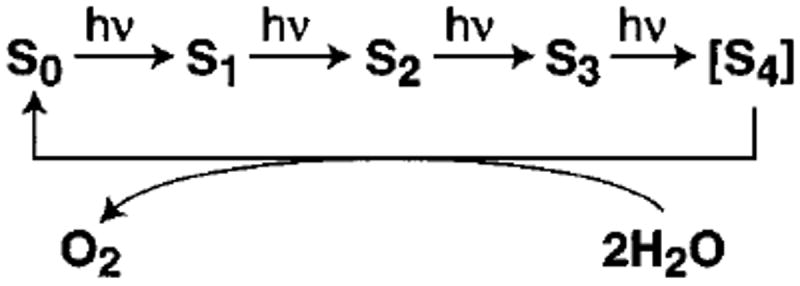
A key question for the understanding of photosynthetic water oxidation is whether the four oxidizing equivalents necessary to oxidize water to dioxygen are accumulated on the four Mn ions of the oxygen-evolving complex (OEC), or whether some ligand-centered oxidations take place before the formation and release of dioxygen during the S(3) --> [S(4)] --> S(0) transition. Progress in instrumentation and flash sample preparation allowed us to apply Mn Kbeta X-ray emission spectroscopy (Kbeta XES) to this problem for the first time. The Kbeta XES results, in combination with Mn X-ray absorption near-edge structure (XANES) and electron paramagnetic resonance (EPR) data obtained from the same set of samples, show that the S(2) --> S(3) transition, in contrast to the S(0) --> S(1) and S(1) --> S(2) transitions, does not involve a Mn-centered oxidation. On the basis of new structural data from the S(3)-state, manganese mu-oxo bridge radical formation is proposed for the S(2) --> S(3) transition, and three possible mechanisms for the O-O bond formation are presented.


Figures

Figure 1
Figure 1
S2-state multiline EPR signal oscillation pattern. (A) EPR difference spectra (flash sample minus buffer spectrum) of the low-field side of the S2 multiline. The spectra shown are the average of all samples used in this study. Spectra from 2, 23, 23, 18, 19, 9, 7, and 8 samples were averaged for the NPF, 0F, 1F, 2F, 3F, 4F, 5F, and 6F spectra, respectively. They are normalized to their total Mn contents, which were determined as described in the Materials and Methods section. The sloping baseline that is apparent at high field is due to a flash-induced background signal in the Lexan sample holders. This signal was shown in flashed empty sample holders to be a very broad EPR signal with no hyperfine structure. Thus, it does not affect the quantitations of the S2-state multiline EPR signal hyperfine peaks. (B) The S2-state multiline EPR signal amplitudes obtained from the designated peaks in Figure 1A are shown as a function of flash number (solid line). The data points are measurements on the spectra from individual samples and are normalized to the Mn content in each sample (see the Materials and Methods section). The best fit to the S2-state multiline EPR signal oscillation pattern (fit no. 4 in Table 1) is shown as a dashed line. All S2-state multiline EPR signal amplitudes were normalized to the average 1F S2-state multiline EPR signal amplitude. Spectrometer conditions: 2800 ± 500 G scan range, 25 000 or 40 000 gain, 30 mW microwave power, 9 K temperature, 32 G modulation amplitude, 100 kHz modulation frequency, 2 min/scan, 2 or 4 scans per sample, 0.25 s time constant, 9.26 GHz microwave frequency. MLS amplitudes were determined from the low-field and high-field peak-to-trough measurements for each designated peak.
Figure 2
Figure 2
Mn K-edge XANES spectra of flash-illuminated PS II samples. (A) Pure S-state spectra (bottom) were obtained from the flash spectra (top) by deconvolution using the inverse of the S-state distribution matrix in Table 2, as described in the text. The pre-edge region (principally a 1s → 3d transition) for the S0–S3 states is shown in the inset. (B) S-state XANES difference spectra. The spectra are multiplied by a factor of 5 and are vertically offset for clarity. The horizontal dashed lines show the zero value for each difference spectrum.
Figure 3
Figure 3
2nd derivatives of Mn K-edge XANES spectra. (A) Samples given 0, 1, 2, or 3 flashes. The individual 2nd-derivative spectra from 7, 6, 7, and 7 samples given 0, 1, 2, or 3 flashes, respectively, are shown. The dashed vertical line marks the average inflection point energy for the 1F spectra. The individual edge spectra from which these 2nd derivatives were calculated were used to generate the composite XANES flash spectra shown in the upper portion of Figure 2A. (B) Deconvoluted S-state spectra. These spectra are the 2nd derivatives of the S-state XANES edge spectra shown in the lower portion of Figure 2A. The dashed vertical line is at the inflection point energy for the S2-state spectrum. Because of the high S-state purity of the flashed samples, the deconvoluted S-state spectra are quite similar to the experimentally obtained flash spectra shown in part A of this figure.
Figure 4
Figure 4
Kβ emission spectra of Mn oxides. This figure shows the changes in the Kβ emission spectrum due to Mn oxidation. The inset shows a pictorial representation of the Kβ fluorescence transition for each of the oxides. The spectra were normalized by the integrated area under the spectra, as described in the Materials and Methods section.
Figure 5
Figure 5
Kβ emission spectra of PS II flash samples. (A) The composite Kβ emission spectrum from 15 individual 0F PS II samples. This spectrum has been reconstructed from piecewise scans of the high-energy tail, Kβ1,3, and Kβ′ regions on each sample, as explained in the Materials and Methods section. (B) Overplots of the Kβ1,3 emission spectra of the 0F, 1F, 2F, and 3F PS II samples. The spectra were normalized as described in the Materials and Methods section. The sum spectra of the first Kβ1,3 emission scans (6 min scan time each) at each sample position are shown. The magnitude of the first-moment shift for Mn2(III)O3 → Mn(IV)O2 (shown in Figure 4) is significantly larger than the first-moment shift for the S1 → S2 transition, where only 1 Mn out of 4 is being oxidized.
Figure 6
Figure 6
Overplots of the normalized (area under the peak) Kβ1,3 emission spectra of PS II samples in the S0, S1, S2, and S3 states. These spectra were generated by deconvoluting the flash spectra shown in Figure 5B, as described in the text.
Figure 7
Figure 7
Kβ emission difference spectra of PS II. The Kβ emission spectra from Figure 6 were smoothed by fitting a cubic polynomial of 3 eV width to each point, and were then subtracted to generate the spectra shown.
Figure 8
Figure 8
First moments of the Kβ1,3 peaks of the PS II flash samples as a function of average X-ray exposure time. The 1st moments were calculated for the energy range shown in Figure 5B. Symbols are the data points and the dashed lines are first-order fits. The error bars reflect the statistical error for each measurement and are based on the total number of counts.
Figure 9
Figure 9
(A) Oscillation of XANES inflection point energies (I.P. E.) of the 0F to 6F samples. (B) Oscillation of first moments (〈E〉) of the Kβ emission spectra from the 0F to 3F samples (4F to 6F were not collected). The extrapolated 〈E〉 values for zero X-ray exposure time from Figure 8 are shown.
Figure 10
Figure 10
S-state scheme for oxygen evolution based on the proposal by Kok et al. The proposed oxidation states of Mn in each of the S-states S0–S3 based on the results from Kβ emission and XANES spectroscopy are shown. For the S3 state, it is proposed that the oxidizing equivalent is stored mainly on a direct ligand to Mn, most likely a μ-oxo bridge, and little of this spin density is present on Mn. The oxidation of a terminal ligand is less likely because of the observed lengthening of the Mn–Mn distances in the S3 state (see text).
Figure 11
Figure 11
Summary of changes in Mn oxidation states and Mn–Mn distances during photosynthetic water oxidation. During the S0 → S1 transition, a Mn(II) → Mn(III) oxidation causes the decrease of the Mn–Mn distance. In the S1 → S2 transition, one Mn(III) is oxidized to Mn(IV), and the Mn–Mn distances do not change. During the S2 → S3 transition, a μ-oxo bridge is oxidized, which triggers the increase in Mn–Mn distances. In the S3 → [S4] → S0 transition, a short-lived peroxo intermediate is formed in the S4 state. Parts A, B, and C are 3 options for O–O bond formation in the S4 state (see text for details). The peroxo intermediate is further oxidized to O2, and two water molecules bind to regenerate the S0 state. For clarity, YZ, the cofactors Ca2+ and Cl, and terminal Mn ligands are not shown. Mn–Mn distances were determined by EXAFS spectroscopy.,, As mentioned in DeRose et al., Cinco et al., and Robblee et al., other possible topological models exist for the OEC; similar mechanisms that can be proposed for each of these alternative topological models should be considered equally viable.
Figure 12
Figure 12
Comparison of Mn K-edge XANES difference spectra of PS II samples in the S0, S1, S2, and S3 states from the present study (also shown in Figure 2B) and from the work of Roelofs et al. In each set of XANES difference spectra, the difference spectrum from the work of Roelofs et al. is presented above the difference spectrum from the present study. The XANES difference spectra have been vertically offset for clarity.
Scheme 1
Scheme 1

Similar articles

Cited by

References

    1. Debus RJ. Biochim Biophys Acta. 1992;1102:269–352. - PubMed
    1. Britt RD. In: Oxygenic Photosynthesis: The Light Reactions. Ort DR, Yocum CF, editors. Vol. 4. Kluwer Academic Publishers; Dordrecht, The Netherlands: 1996. pp. 137–164.
    1. Diner BA, Babcock GT. In: Oxygenic Photosynthesis: The Light Reactions. Ort DR, Yocum CF, editors. Vol. 4. Kluwer Academic Publishers; Dordrecht, The Netherlands: 1996. pp. 213–247.
    1. Kok B, Forbush B, McGloin M. Photochem Photobiol. 1970;11:457–475. - PubMed
    1. Brudvig GW, Crabtree RH. Proc Natl Acad Sci U S A. 1986;83:4586–4588. - PMC - PubMed

MeSH terms