. 2001 Aug 14;98(17):9642-7.
doi: 10.1073/pnas.171160298. Epub 2001 Aug 7.

Segregation of leading-edge and uropod components into specific lipid rafts during T cell polarization

Affiliations

Segregation of leading-edge and uropod components into specific lipid rafts during T cell polarization

C Gómez-Móuton et al. Proc Natl Acad Sci U S A. .

Abstract

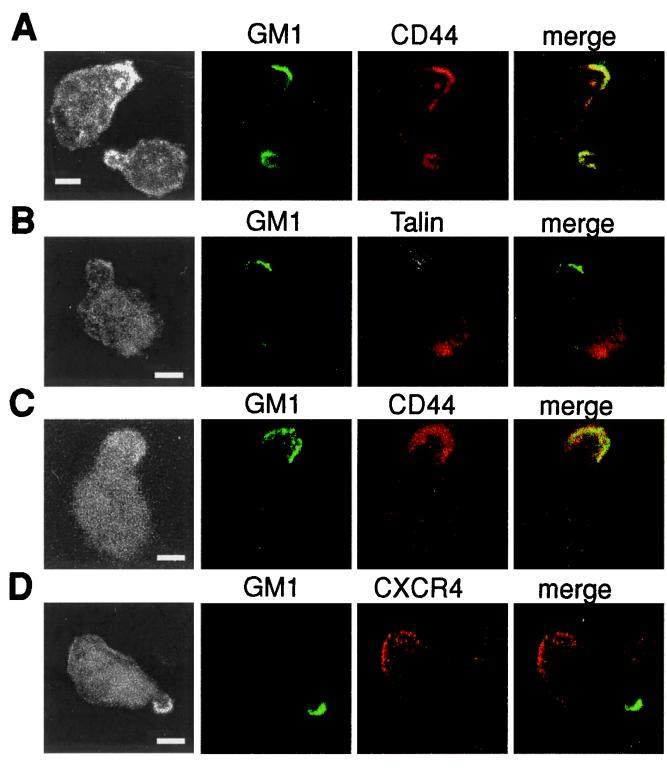
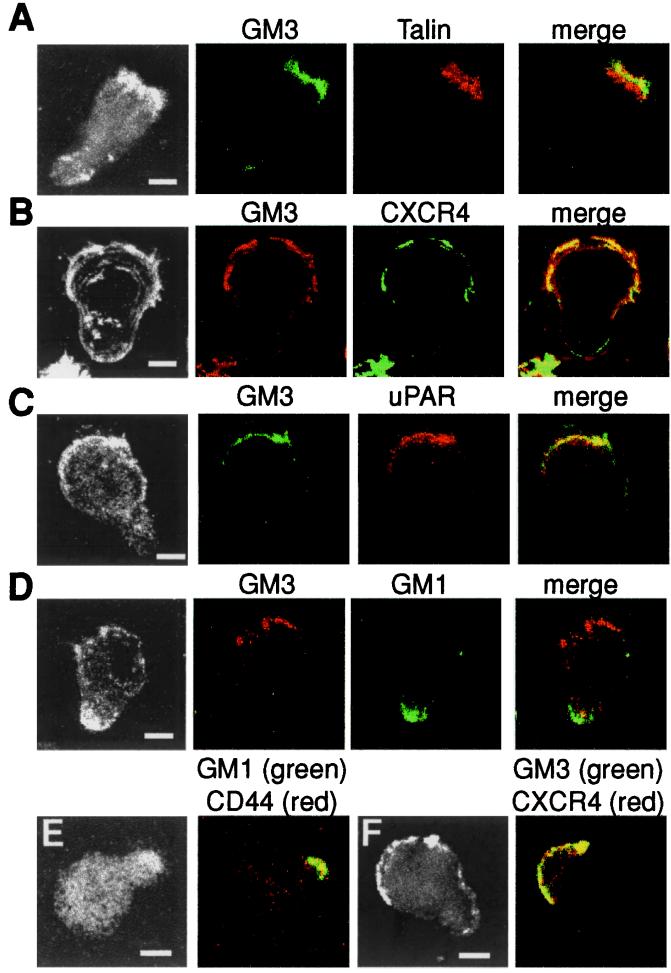
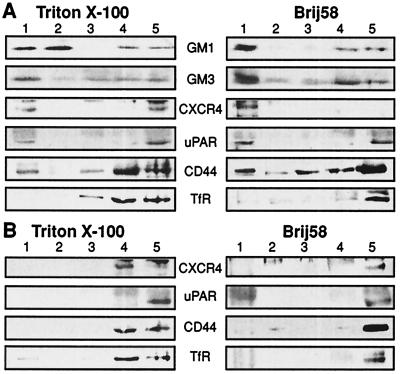
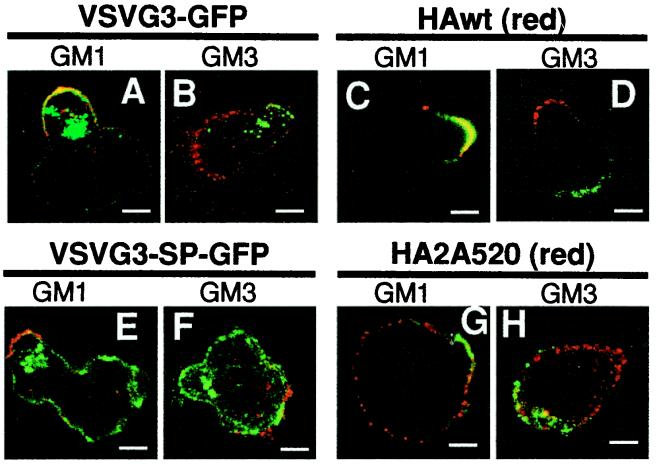
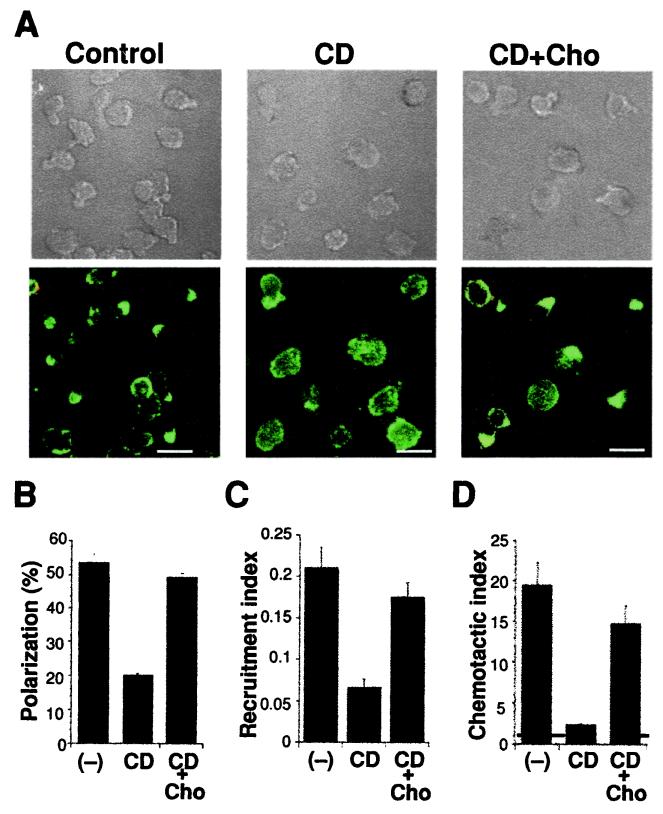
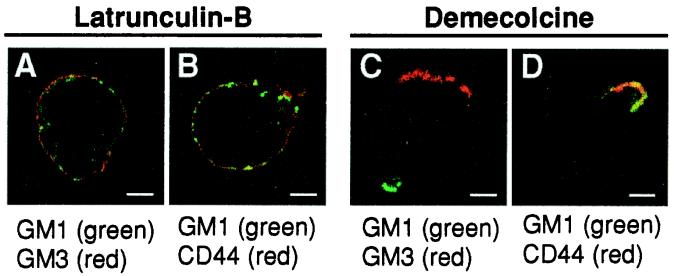
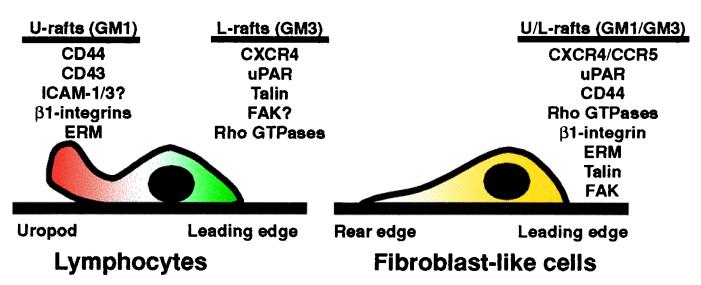
Redistribution of specialized molecules in migrating cells develops asymmetry between two opposite cell poles, the leading edge and the uropod. We show that acquisition of a motile phenotype in T lymphocytes results in the asymmetric redistribution of ganglioside GM3- and GM1-enriched raft domains to the leading edge and to the uropod, respectively. This segregation to each cell pole parallels the specific redistribution of membrane proteins associated to each raft subfraction. Our data suggest that raft partitioning is a major determinant for protein redistribution in polarized T cells, as ectopic expression of raft-associated proteins results in their asymmetric redistribution, whereas non-raft-partitioned mutants of these proteins are distributed homogeneously in the polarized cell membrane. Both acquisition of a migratory phenotype and SDF-1alpha-induced chemotaxis are cholesterol depletion-sensitive. Finally, GM3 and GM1 raft redistribution requires an intact actin cytoskeleton, but is insensitive to microtubule disruption. We propose that membrane protein segregation not only between raft and nonraft domains but also between distinct raft subdomains may be an organizational principle that mediates redistribution of specialized molecules needed for T cell migration.


Figures

Figure 1
Figure 1
GM1-rafts concentrate at the uropod of migrating T cells. NS-1 (A and B) or SDF-1α-stimulated Jurkat cells (C and D) were costained with CTx to reveal GM1 (green), with leading edge or uropod markers indicated (red), and analyzed by confocal microscopy. Fluorescence is shown for each signal and for the merging of both; colocalization is seen as yellow. To visualize cell shape (Left), laser power was saturated for green and red channels. These cells are representative of the majority of cells recorded in independent experiments. (Bar = 2 μm.)
Figure 2
Figure 2
GM1- and GM3-rafts segregate to opposite cell edges in T cells. Confocal analysis of NS-1 (A and D), SDF-1α-stimulated Jurkat cells (B and C), and SDF-1α-stimulated PBLs (E and F) costained with anti-GM3 antiserum or CTx and with various leading-edge and uropod markers, as indicated. For NS-1 and Jurkat cells, fluorescence for each channel and the merging of both signals are shown, whereas only merging is displayed for PBLs; colocalization of the signals is seen as yellow. (Bar = 2 μm.)
Figure 3
Figure 3
GM1- and GM3-associated molecules partition in cholesterol-sensitive DRM. Jurkat cells were stimulated with SDF-1α, then left untreated (A) or CD-treated (B). Cells were lysed in TNE buffer with Triton X-100 or Brij58 and fractionated in Optiprep gradients. Fractions were collected from gradient top (DRM) to bottom (detergent-soluble proteins and cytoskeleton) and analyzed by Western blotting with the indicated antibodies; GM1 was detected with biotinylated CTx. TfR, transferrin receptor.
Figure 4
Figure 4
Raft association is a requisite for membrane protein redistribution in polarized T cells. Distribution of VSVG3-GFP (A and B) or HA wild type (HAwt; C and D), and of mutants VSVG3-SP-GFP (E and F) or HA2A520 (G and H) in NS-1 cells was analyzed after copatching with anti-GM3 antibody or FITC-CTx, as indicated. The panels show red and green signal overlay. In the case of VSVG3 (green), GM1 and GM3 are visualized in red; for HAwt (red), GM1 and GM3 are in green. Colocalization is seen as yellow. The proportion of cells showing asymmetrical distribution was calculated by direct counting (n = 50–60) of transduced cells with a polarized phenotype. (Bar = 2 μm.)
Figure 5
Figure 5
Membrane rafts mediate the front–rear polarity required for T cell function. (A) Membrane cholesterol depletion impairs cell polarization. Panels show phase-contrast images (Upper) and CD44 distribution (Lower) of untreated (Control), CD-treated (CD), and cholesterol-replenished (CD+Cho) NS-1 cells. (Bar = 10 μm.) Bars in BD: untreated (−), CD-treated (CD), and cholesterol replenished (CD+Cho). (B) Random fields (n = 8) in two independent experiments were recorded. Cells with a polarized phenotype (as determined by morphology and CD44-polarization) were counted directly. Total cells recorded: untreated, 250; CD-treated, 205; CD + Cho, 210. (C) Raft integrity is required for bystander T cell recruitment. Untreated, CD-treated, and cholesterol-replenished Jurkat cells were stimulated with SDF-1α and PBL recruitment was analyzed by direct counting. Data are expressed as a recruitment index (see Materials and Methods). (D) Cholesterol depletion inhibits cell chemotaxis. Untreated, CD-treated, and cholesterol-replenished Jurkat cells were assayed for chemotaxis toward SDF-1α. Cells in the lower chamber were recovered, and the number was estimated by flow cytometry. The figure shows the chemotactic index, calculated as described in Materials and Methods.
Figure 6
Figure 6
Raft distribution requires intact actin cytoskeleton. NS-1 cells were treated with latrunculin-B (A and B) or demecolcine (C and D) and the distribution of GM1 and GM3 (A and C) or GM1 and CD44 (B and D) was analyzed by confocal microscopy. Images are representative of cells recorded (n = 40) in two independent experiments. (Bar = 2 μm.)
Figure 7
Figure 7
Model for the redistribution of membrane rafts and associated proteins in migrating T cells and fibroblast-like cells. The scheme shows the segregation of U-rafts (GM1-enriched) and L-rafts (GM3-enriched) in migrating T cells, as well as the predictive association of membrane receptors and signaling molecules to each raft type, based on our results or those in literature (1, 36). In fibroblast-like cells, both U- and L-rafts probably redistribute to the leading edge; see Discussion for details. ERM, ezrin–radixin–moesin.

Comment in

  • Flotillas of lipid rafts fore and aft.
    Pierini LM, Maxfield FR. Pierini LM, et al. Proc Natl Acad Sci U S A. 2001 Aug 14;98(17):9471-3. doi: 10.1073/pnas.181353098. Proc Natl Acad Sci U S A. 2001. PMID: 11504934 Free PMC article. No abstract available.

References

    1. Sánchez-Madrid F, del Pozo M. EMBO J. 1999;18:501–511. - PMC - PubMed
    1. Mañes S, Mira E, Gómez-Moutón C, Lacalle R, Martínez-A C. IUBMB Life. 2000;49:89–96. - PubMed
    1. Seveau S, Keller H, Maxfield F, Piller F, Halbwachs-Mecarelli L. Blood. 2000;95:2462–2470. - PubMed
    1. Mañes S, Mira E, Gómez-Moutón C, Lacalle R, Keller P, Labrador J, Martinez-A C. EMBO J. 1999;18:6211–6220. - PMC - PubMed
    1. Harder T, Simons K. Eur J Immunol. 1999;29:556–562. - PubMed

Publication types