. 2001 May-Jun;3(3):227-35.
doi: 10.1038/sj.neo.7900151.

Acute metabolic alkalosis enhances response of C3H mouse mammary tumors to the weak base mitoxantrone

Affiliations

Acute metabolic alkalosis enhances response of C3H mouse mammary tumors to the weak base mitoxantrone

N Raghunand et al. Neoplasia. 2001 May-Jun.

Abstract

Uptake of weak acid and weak base chemotherapeutic drugs by tumors is greatly influenced by the tumor extracellular/interstitial pH (pH(e)), the intracellular pH (pH(i)) maintained by the tumor cells, and by the ionization properties of the drug itself. The acid-outside plasmalemmal pH gradient in tumors acts to exclude weak base drugs like the anthracyclines, anthraquinones, and vinca alkaloids from the cells, leading to a substantial degree of "physiological drug resistance" in tumors. We have induced acute metabolic alkalosis in C3H tumor-bearing C3H/hen mice, by gavage and by intraperitoneal (i.p.) administration of NaHCO(3). (31)P magnetic resonance spectroscopic measurements of 3-aminopropylphosphonate show increases of up to 0.6 pH units in tumor pH(e), and 0.2 to 0.3 pH units in hind leg tissue pH(e), within 2 hours of i.p. administration of NaHCO(3). Theoretical calculations of mitoxantrone uptake into tumor and normal (hind leg) tissue at the measured pH(e) and pH(i) values indicate that a gain in therapeutic index of up to 3.3-fold is possible with NaHCO(3) pretreatment. Treatment of C3H tumor-bearing mice with 12 mg/kg mitoxantrone resulted in a tumor growth delay of 9 days, whereas combined NaHCO(3)--mitoxantrone therapy resulted in an enhancement of the TGD to 16 days.


Figures

Figure 1
Figure 1
A series of 31P MR spectra were obtained from a 975-mm3 C3H tumor before and after i.p. administration of 0.7 mlx1 M NaHCO3 to the mouse at t=0 minutes. Chemical shifts are calibrated against the α-NTP resonance, which is set to -10.05 ppm. By 1 hour postinjection, the pHe of the tumor is substantially raised, as indicated by the shift of the 3-APP resonance upfield to lower ppm values, and this increase persists through 4 hours postinjection. Tumor pHi is increased to a small extent by 4 hours postinjection as well, as indicated by the shift to higher ppm values of the Pi resonance.
Figure 2
Figure 2
A series of 31P MR spectra were obtained from the hind leg of a C3H/Hen mouse before and after i.p. administration of 0.7 mlx1 M NaHCO3 to the mouse at t=0 minutes. Signal intensities of both the 3-APP and Pi peaks were low compared with spectra obtained from tumors. A small shift of the 3-APP peak to lower ppm values is visible by 45 minutes postinjection, indicating alkalinization of tissue pHe. A small shift of the Pi resonance to higher ppm values is also visible, indicating alkalinization of pHi. The intensities of the phosphocreatine peak (≈-2.5 ppm) and the NTP peaks ≈-5, -10.05, and -18.5 ppm) did not change significantly during the course of MRS experiment. The inset shows the calculated pHe and pHi versus time in hind leg tissue from these spectra. Both pHe and pHi are seen to increase slightly following i.p. administration of 0.7 mlx1 M NaHCO3.
Figure 3
Figure 3
pHe and pHi versus time in C3H tumors from four different animals that were administered 0.7 mlx1 M NaHCO3 (i.p.) at t=0 minutes. The larger tumors in panels B to D can be seen to have more acidic pHe and pHi before NaHCO3 administration than the smaller tumor shown in panel A. The more acidic tumors in B to D show increases of both pHe and pHi by 2 hours postinjection of the NaHCO3, whereas the neutral tumor in A did not alkalinize in response to the NaHCO3 bolus.
Figure 4
Figure 4
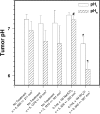
Average pHe and pHi values (±SD) from C3H tumors in control mice, and in mice that were administered either NaHCO3 or NH4Cl (0.7 mlx1 M) by gavage. Tumors from control mice were separated into three categories based on size. Neither pHe nor pHi was significantly affected by tumor size for tumors in the control group (P > .2). Tumor pHi in NaHCO3-treated mice was not significantly different from tumor pHi in control animals (P > .05 against tumors in all three control groups). #Tumor pHe was significantly higher in NaHCO3-treated mice compared to tumors in untreated control mice in the two larger size categories (P < .05). Tumor pHe in NaHCO3-treated mice was marginally higher than tumor pHe in the smallest group of tumors (688±211 mm3) in control mice (P = .06). *Both tumor pHi and tumor pHe were significantly lower in NH4Cl-treated mice than in control mice regardless of tumor size (P < .03 in all cases).
Figure 5
Figure 5
Average pHe and pHi values (±SD) from normal hind leg tissue in control mice, and in mice that were administered either NaHCO3 or NH4Cl (0.7 mlx1 M) by gavage. Gavage administration of NaHCO3 did not result in significant changes in either pHe (P=.5) or pHi (P=.17). *Gavage administration of NH4Cl resulted in a considerable drop in pHe (P=.003) as well as pHi (P=.04) of hind leg tissue in treated mice compared with control mice.
Figure 6
Figure 6
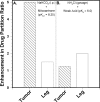
Theoretically calculated tissue-blood drug partition ratios: (A) from Equation 1, for combined NaHCO3 (i.p.) and mitoxantrone therapy, and (B) from Equation 2, for combined therapy using NH4Cl (gavage) and a hypothetical singly charged weak acid drug of pKa=6.0. For mitoxantrone a pKa2 of 12 was assumed, because Equation 1 is insensitive to pKa2 for physiological values of pHi and pHe. The following representative values of pHe and pHi in control/NaHCO3-treated/NH4Cl-treated animals, respectively, were obtained from the data reported in Figures 2–5 — tumor pHi 7.05/7.3/6.7, tumor pHe 6.7/7.3/6.16, hind leg pHi 7.33/7.5/7.15, and hind leg pHe 7.35/7.6/6.8 — and inserted into Equations 1 and 2 to obtain the drug partition ratios shown here. Pretreatment with NaHCO3 (i.p.) is predicted to result in a five-fold enhancement in uptake of mitoxantrone into tumor tissue compared to tumor tissue in an untreated host, but only a 1.5-fold increase in uptake of drug into normal tissue in the NaHCO3-treated animal compared with normal tissue in an untreated animal. Thus, the chemotherapeutic index of mitoxantrone can potentially be increased 3.3-fold by NaHCO3 pretreatment of the host animal. However, acidosis induced by gavage administration of NH4Cl to the host animal is not tumor specific, resulting in a two-fold increase in uptake of a weak acid drug of pKa 6 into normal tissue and only a 1.2-fold increase in uptake into tumor tissue. Thus, the chemotherapeutic index of a weak acid drug is predicted to be reduced by gavage administration of NH4Cl.
Figure 7
Figure 7
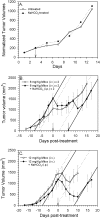
Growth curves for C3H tumors in (A) untreated mice and NaHCO3 (0.7 mlx1 M, i.p.)-treated mice; (B) mitoxantrone (6 mg/kgx2)-treated mice and mitoxantrone (6 mg/kgx2) plus NaHCO3 (0.7 mlx1 Mx2, i.p.)-treated mice; (C) mitoxantrone (12 mg/kg)-treated mice and mitoxantrone (12 mg/kg) plus NaHCO3 (0.7 mlx1 M, i.p.)-treated mice. Each point in panels A to C represents the mean tumor volume from cohorts of four mice per treatment group. Error bars in panels B and C represent standard deviations. NaHCO3 treatment alone was found to not affect the growth rate of C3H tumors (panel A). Treatment with mitoxantrone alone resulted in a TGD of 9 days, regardless of whether the 12 mg/ kg dose was fractionated into two doses (panel B) or given as a single bolus (panel C). Combined treatment with mitoxantrone and NaHCO3 resulted in a TGD of 15 to 16 days, regardless of dose fractionation. Pretreatment with NaHCO3 resulted in an increase in log10 cell kill from 0.9 to 1.56, corresponding to a greater than 4.5-fold increase in cell kill.

References

    1. Tannock IF, Rotin D. Acid pH in tumors and its potential for therapeutic exploitation. Cancer Res. 1989;49:4373–4384. - PubMed
    1. Gerweck LE, Seetharaman K. Cellular pH gradient in tumor versus normal tissue: potential for exploitation for the treatment of cancer. Cancer Res. 1996;56:1194–1198. - PubMed
    1. Wike-Hooley JL, Haveman J, Reinhold HS. The relevance of tumour pH to the treatment of malignant disease. Radiother Oncol. 1984;2:343–366. - PubMed
    1. Gerweck LE. Tumor pH: implications for treatment and novel drug design. Semin Radiat Oncol. 1998;8:176–182. - PubMed
    1. Stubbs M, Bhujwalla ZM, Tozer GM, Rodrigues LM, Maxwell RJ, Morgan R, Howe FA, Griffiths JR. An assessment of 31P MRS as a method of measuring pH in rat tumours. NMR Biomed. 1992;5:351–359. - PubMed

Publication types

MeSH terms

LinkOut - more resources