. 2001 Aug;22(7):1326-33.

Frequencies contributing to functional connectivity in the cerebral cortex in "resting-state" data

Affiliations

Frequencies contributing to functional connectivity in the cerebral cortex in "resting-state" data

D Cordes et al. AJNR Am J Neuroradiol. 2001 Aug.

Abstract

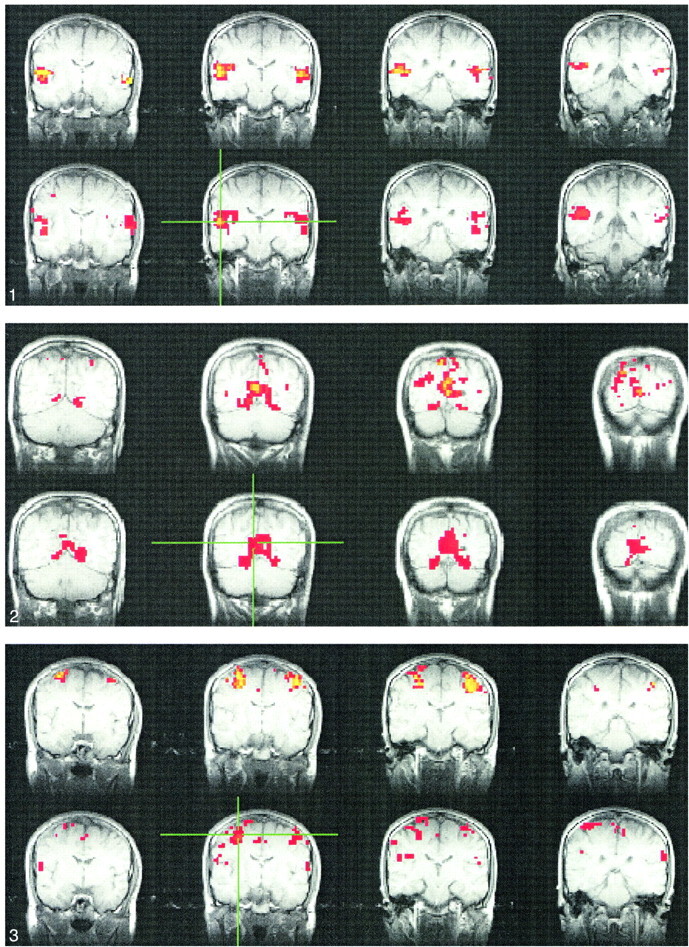
Background and purpose: In subjects performing no specific cognitive task ("resting state"), time courses of voxels within functionally connected regions of the brain have high cross-correlation coefficients ("functional connectivity"). The purpose of this study was to measure the contributions of low frequencies and physiological noise to cross-correlation maps.

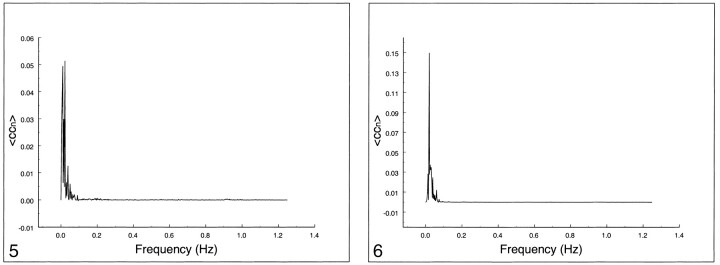
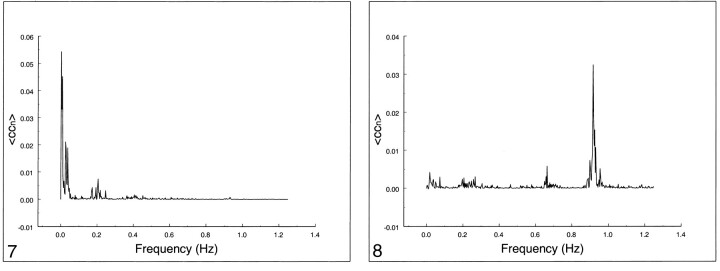
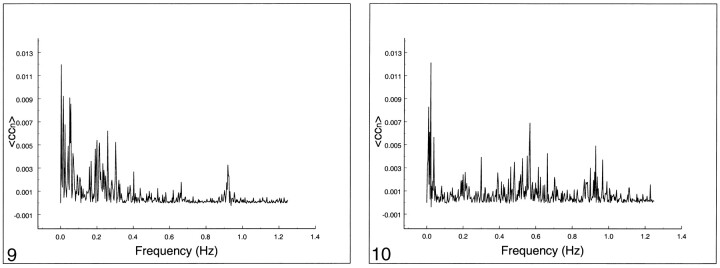
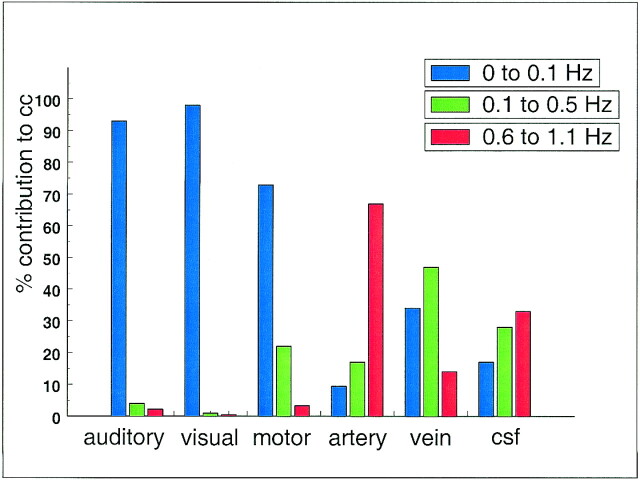
Methods: In four healthy volunteers, task-activation functional MR imaging and resting-state data were acquired. We obtained four contiguous slice locations in the "resting state" with a high sampling rate. Regions of interest consisting of four contiguous voxels were selected. The correlation coefficient for the averaged time course and every other voxel in the four slices was calculated and separated into its component frequency contributions. We calculated the relative amounts of the spectrum that were in the low-frequency (0 to 0.1 Hz), the respiratory-frequency (0.1 to 0.5 Hz), and cardiac-frequency range (0.6 to 1.2 Hz).

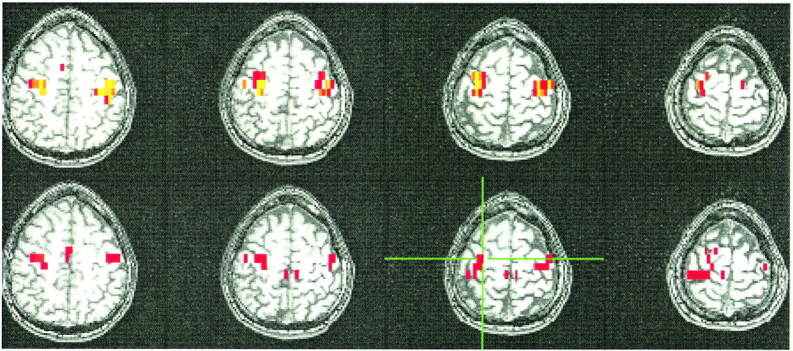
Results: For each volunteer, resting-state maps that resembled task-activation maps were obtained. For the auditory and visual cortices, the correlation coefficient depended almost exclusively on low frequencies (<0.1 Hz). For all cortical regions studied, low-frequency fluctuations contributed more than 90% of the correlation coefficient. Physiological (respiratory and cardiac) noise sources contributed less than 10% to any functional connectivity MR imaging map. In blood vessels and cerebrospinal fluid, physiological noise contributed more to the correlation coefficient.

Conclusion: Functional connectivity in the auditory, visual, and sensorimotor cortices is characterized predominantly by frequencies slower than those in the cardiac and respiratory cycles. In functionally connected regions, these low frequencies are characterized by a high degree of temporal coherence.


Figures

<sc>fig</sc> 1.
fig 1.
Consecutive coronal fMR maps of voxels activated by a text-listening task (top) and of the voxels functionally connected with a 2 × 2-seed voxel ROI (crosshairs) within the auditory cortex during resting-state (bottom). Task activation is evident in the region of the primary and association auditory cortices in the superior temporal lobe. Many of the voxels functionally connected with the seed voxels in the left auditory cortex (crosshairs) have a similar distribution. All maps are representative and are from a single subject. The color scale for the task-activation map refers to z scores (red z, 3.5; yellow z, 5.5), and that for the resting-state map refers to correlation coefficients (red, 0.5; yellow, 0.7). The MR pulse sequence parameters are 2000/50/82 (TR/TE/flip angle) for fMR and 400/50/50 for fcMR.fig 2. Consecutive coronal images showing task activation for the visual task (top) and connectivity for the visual cortex in resting-state (bottom). The task produces activation in the striate cortex region. The voxels with connectivity to the seed voxel (crosshairs) appear to lie in similar locations in the striate cortex region. The color scale for the task-activation map refers to z scores (red z, 3.5; yellow z, 5.5), and that for the resting-state map refers to correlation coefficients (red, 0.6; yellow, 0.8). The MR pulse sequence parameters are as in figure 1.fig 3. A selected coronal fMR map of voxels activated by the bilateral finger-tapping task (top) and of voxels functionally connected to an ROI of 2 × 2-seed voxels (crosshairs) in the sensorimotor cortex in a resting acquisition (bottom). The sensorimotor cortex is identified in both the fMR and the fcMR imaging. Not shown are voxels within the dentate nucleus of the cerebellum that were identified with fMR but not with the functional connectivity study. The color scale for the task-activation map refers to z scores (red z, 3.5; yellow z, 5.5), and that for the resting-state map refers to correlation coefficients (red, 0.62; yellow, 0.8). The MR pulse sequence parameters are as in figure 1
<sc>fig</sc> 4.
fig 4.
A selected axial fMR map of voxels activated by the bilateral finger-tapping task (top) and of the voxels functionally connected to an ROI of 2 × 2-seed voxels (crosshairs) in the sensorimotor cortex in a resting-state acquisition (bottom). The sensorimotor cortex is identified in both the fMR and the fcMR maps. The SMA is not activated by the paradigm, but connectivity is clearly seen. The color scale for the task-activation map refers to z scores (red z, 3.5; yellow z, 5.5), and that for the resting-state map refers to correlation coefficients (red, 0.62; yellow, 0.8). The MR pulse sequence parameters are as in figure 1
<sc>fig</sc> 5.
fig 5.
Spectral analysis of the average correlation coefficient for interregional connectivity in the auditory cortex (same subject illustrated in figure 1). Only frequency components between 0 and 0.05 Hz contribute significantly to the correlation coefficient.fig 6. Spectral analysis of the average correlation coefficient for interregional connectivity in the striate cortex (same subject illustrated in figure 2). Only frequency components less than 0.05 Hz contribute significantly to the correlation coefficient
<sc>fig</sc> 7.
fig 7.
Spectral analysis of the average correlation coefficient for interregional connectivity in the motor cortex (same subject illustrated in figure 3). Only the same low-frequency components contribute significantly to the correlation coefficient.fig 8. Spectral analysis of the average correlation coefficient obtained using a seed voxel in the right internal carotid artery. Low frequencies do not predominate. The main peak occurs at the cardiac frequency (0.93 Hz); the first harmonic is aliased to 0.65 Hz. A respiratory band is seen at 0.2 Hz
<sc>fig</sc> 9.
fig 9.
Spectral analysis of the average correlation coefficient from a seed voxel in the left jugular vein. Note the spread over many frequencies up to 0.4 Hz and the cardiac peaks at 0.93 Hz and 0.65 Hz.fig 10. Spectral analysis of the average correlation coefficient obtained using a seed voxel in the left ventricle. Note the spread over many frequencies. The cardiac bands show a large spread compared with other tissue. Low-frequency peaks are visible at 0.03 Hz
<sc>fig</sc> 11.
fig 11.
Contribution of low frequencies (0 to 0.1 Hz), respiratory frequencies (0.1 to 0.5 Hz), and cardiac frequencies to the cross-correlation coefficient in different ROIs in the same subject. Low-frequency components clearly dominate, contributing to functional connectivity in auditory, visual, and motor cortices. For blood vessels and cerebrospinal fluid, low-frequency components are present, but cardiac and respiratory noise sources are the main contributors

References

    1. Haughton VM, Biswal B. Clinical application of basal regional cerebral blood flow fluctuation measurements by FMRI. In: Hudetz A, Bruley D, eds. Oxygen Transport to Tissue. New York: Plenum Publishing Corp.; 1998:583–590 - PubMed
    1. Biswal B, Yetkin FZ, Haughton VM, Hyde JS. Functional connectivity in the motor cortex of resting human brain using echo-planar MR imaging. Magn Reson Med 1995;34:537-541 - PubMed
    1. Lowe MJ, Mock BJ, Sorenson JA. Functional connectivity in single and multislice echoplanar imaging using resting state fluctuations. Neuroimage 1998;7:119-132 - PubMed
    1. Lowe MJ, Mock BJ, Sorenson JA. Resting state fMRI signal correlation in multi-slice. Neuroimage 1996;3:S257
    1. Xiong J, Parsons LM, Gao JH, Fox PT. Interregional connectivity to primary motor cortex revealed using MRI resting state images. Hum Brain Mapp 1999;8:151-156 - PMC - PubMed