. 2001 Aug 15;20(16):4588-602.
doi: 10.1093/emboj/20.16.4588.

Human origin recognition complex binds to the region of the latent origin of DNA replication of Epstein-Barr virus

Affiliations

Human origin recognition complex binds to the region of the latent origin of DNA replication of Epstein-Barr virus

A Schepers et al. EMBO J. .

Abstract

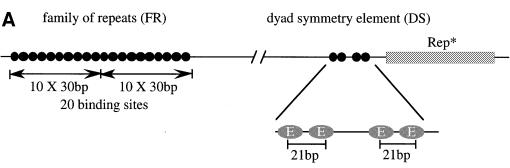
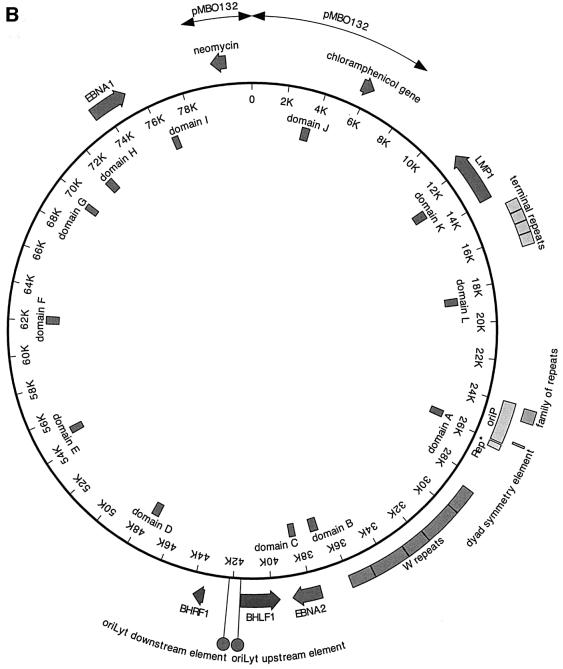
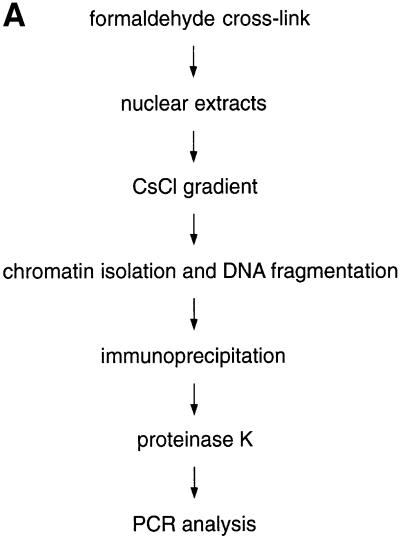
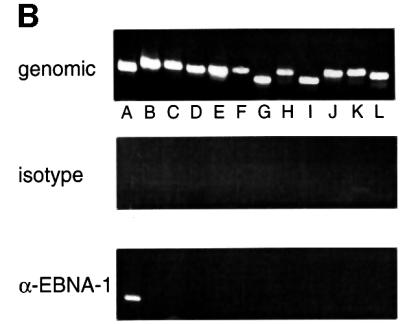
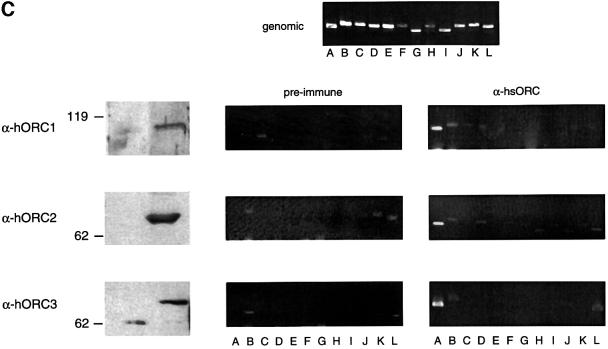
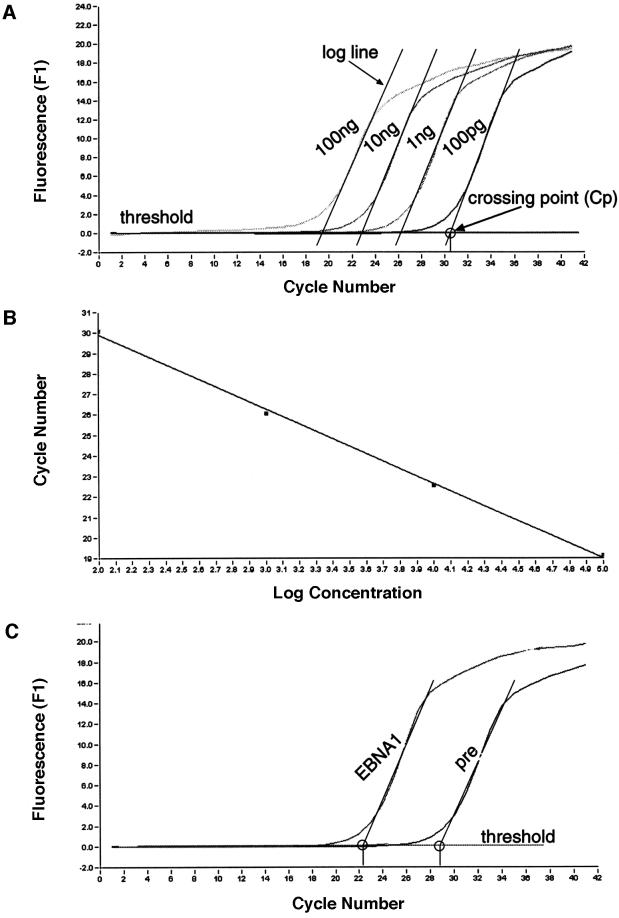
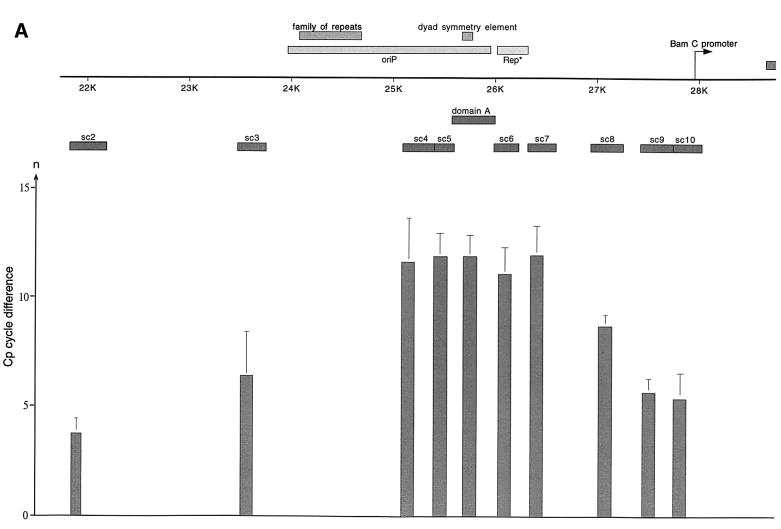
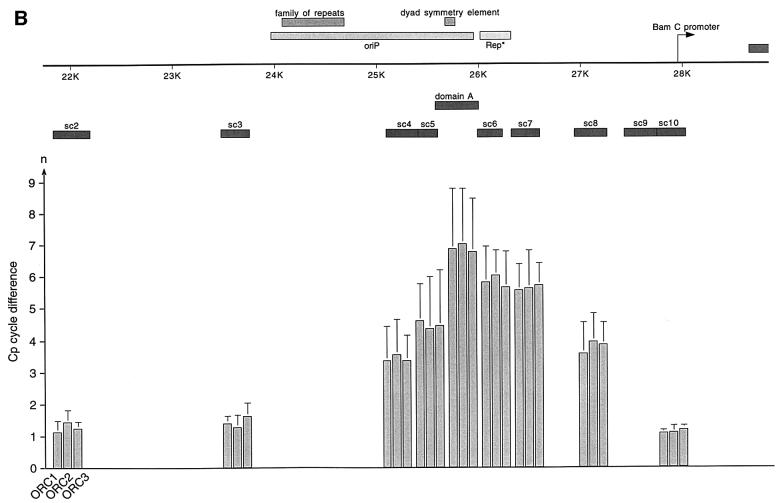
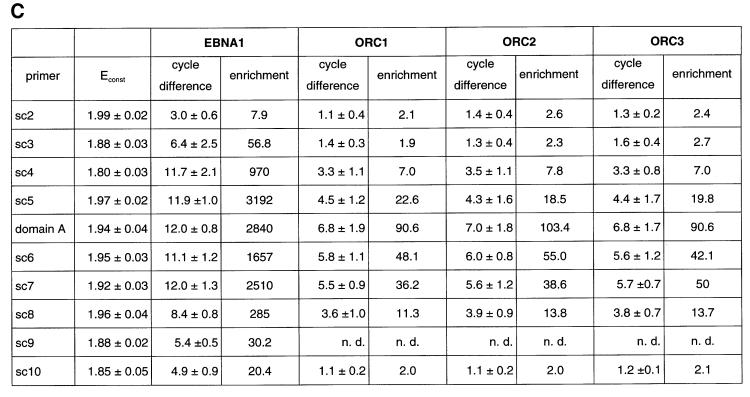
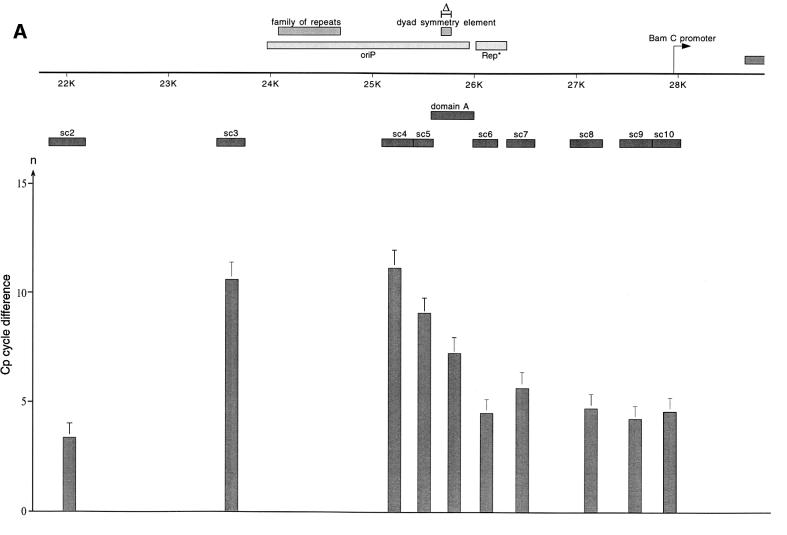
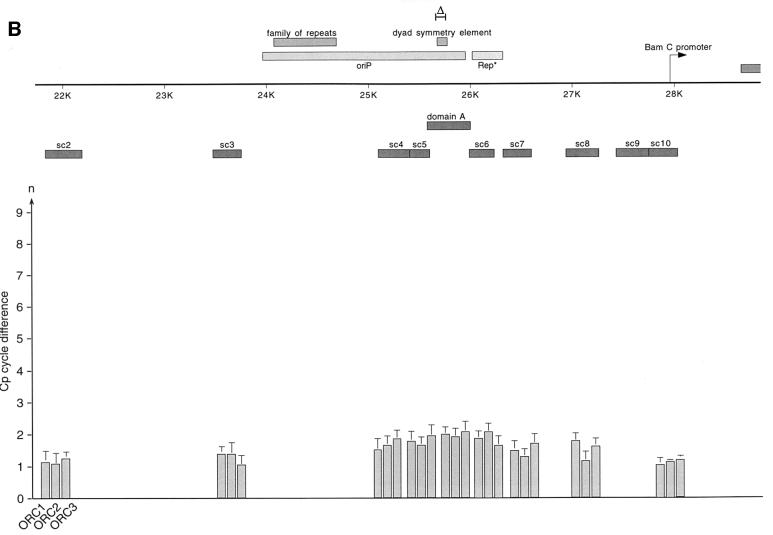
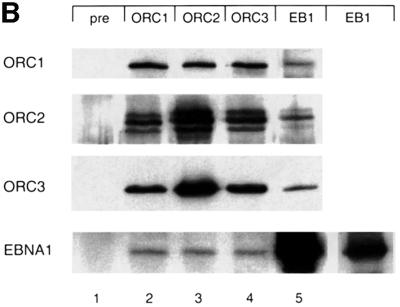
Epstein-Barr virus (EBV) replicates in its latent phase once per cell cycle in proliferating B cells. The latent origin of DNA replication, oriP, supports replication and stable maintenance of the EBV genome. OriP comprises two essential elements: the dyad symmetry (DS) and the family of repeats (FR), both containing clusters of binding sites for the transactivator EBNA1. The DS element appears to be the functional replicator. It is not yet understood how oriP-dependent replication is integrated into the cell cycle and how EBNA1 acts at the molecular level. Using chromatin immunoprecipitation experiments, we show that the human origin recognition complex (hsORC) binds at or near the DS element. The association of hsORC with oriP depends on the DS element. Deletion of this element not only abolishes hsORC binding but also reduces replication initiation at oriP to background level. Co-immunoprecipitation experiments indicate that EBNA1 is associated with hsORC in vivo. These results indicate that oriP might use the same cellular initiation factors that regulate chromosomal replication, and that EBNA1 may be involved in recruiting hsORC to oriP.


Figures

None
Fig. 1. (A) The bipartite structure of oriP. The dyad symmetry (DS) and the family of repeats (FR) are the two essential elements of oriP. Each black circle (oval in the enlargement) represents a single binding site for an EBNA1 dimer. At the DS element, a spacing of 21 bp exists between neighbouring pairs of EBNA1-binding sites (E). The binding sites within the FR were determined experimentally (Ambinder et al., 1990). It consists of two blocks of 10 EBNA1-binding sites showing dyad symmetry. Rep* is a 298 bp DNA fragment that can partially substitute for the DS element if multimerized on a plasmid (Kirchmaier and Sugden, 1998). (B) Human primary B cells were immortalized with the 81 kbp derived mini-EBV plasmid 1478.A. Functional elements are shown on the outer circle. The latent viral genes EBNA1, EBNA2 and LMP1 are depicted. oriP, the latent origin of DNA replication, is shown with its two essential components, FR and DS, and the non-essential element Rep*. The second origin of DNA replication of EBV, oriLyt, is active only during the lytic phase. The two components are indicated as circles. The plasmid backbone of this episome stems from the F-factor plasmid pMBO132 (arrows). The terminal repeats and the W repeats, repetitive sequences within the episome, are shown. The terminal repeats are essential elements for packaging of the viral genome. The inner circle of the map indicates the location and designation of the fragments that were analysed by PCR amplification after immunoprecipitation (see Table I).
None
Fig. 2. In vivo association of EBNA1 and hsORC with oriP analysed by formaldehyde cross-linking. (A) Scheme of the ChIP protocol; see Materials and methods for details. (B) Asynchronously proliferating A39 cells were subjected to the ChIP protocol and, after cell lysis, nuclear extracts were divided into two parts. One half was immunoprecipitated with the 1H4 antibody directed against EBNA1 (bottom panel) and the other half was immunoprecipitated with an irrelevant antibody of the same isotype (middle panel). PCR was performed on sonicated chromatin, isolated after immunoprecipitation, or on 2 ng of sheared genomic DNA (top panel). The positions of the DNA fragments A–L are indicated within the centre of the mini-EBV genome. (C) ChIP assay with polyclonal antibodies directed against different subunits of the human ORC. Immunoblots performed with the indicated polyclonal rabbit antibodies and pre-immune sera are shown on the left. These antibodies were used for all ChIP experiments. They detect specific signals at the expected size for hsORC1 (105 kDa), hsORC2 (68 kDa) and hsORC3 (72 kDa). The pre-immune sera show no signal at the corresponding positions (left panel). The association of hsORC with the corresponding DNA fragments was analysed as described above. The top panel shows the amplification of all 12 fragments tested with sheared genomic DNA as template. A 300 pg aliquot of total genomic 1478.A DNA were used for each control reaction.
None
Fig. 3. Parameters for quantification of real-time PCR products. (A) The histogram shows the amplification profile of PCR products amplified from a series of 10-fold dilutions using cross-linked genomic DNA prior to any immunoprecipitation. Only one example with the primer pair psc10 is shown to demonstrate the principles of data collection and processing. To calculate the efficiency of the immunoprecipitation with the different antibodies, the concentration of the input genomic DNA was determined photometrically. To follow the amplification of the PCR product, a fluorescent dye was used in the real-time PCR. The fluorescence was indicative of the concentration of the amplified PCR fragments and was plotted against the cycle number (x-axis). Analysis of the PCR products was performed during the exponential phase (log phase) of the amplification and is not based on the end point of the reaction as in conventional PCR techniques. The log phase begins when sufficient product has accumulated to be detected above background and ends when the reaction enters the plateau. In theory, the PCR product is duplicated in a single PCR round and is described by the formula N = N0 × 2n (N, number of molecules; N0, number of starting molecules). In reality, the efficiency of the PCR is constant only during the log phase but usually is <2 and is described by the equation: N = N0 × (Econst)n. The log line of the exponential phase is calculated and set against the threshold line that subtracts the background (black lines in A). The threshold was determined automatically by the machine using the standard settings (second derivative method; for details, see LightCycler operator’s manual, version 3.5). The crossing of the log line and the threshold line defines the crossing point (Cp). (B) The standard curve of the given example is the linear regression line through the data points on a plot of Cp versus the logarithm of standard sample concentration. The purpose of the standard curve is 2-fold. It illustrates the range in which the collected data fit with the reconstruction of the initial template concentration. In addition, the standard curve also allows the calculation of the amplification efficiency of the reaction (Econst). Econst can be calculated from the slope of the standard curve using the formula Econst = 10–1/slope. In the given example, the slope is –3.74; the reaction efficiency is therefore 1.85.The amplification efficiency for each primer pair used in the scanning analysis was determined by dilution series and is listed in Figure 4C. (C) To determine the specific enrichment of a fragment after immunoprecipitation with a specific antibody, the difference between the crossing points of the specific immunoprecipitate and the isotype/pre-immune control was calculated. The graph shows the example of an EBNA1 immunoprecipitation; the Cp difference is 6.4 cycles. This number is the exponent to the basis Econst = 1.85. The enrichment of the EBNA1 immunoprecipitation is calculated by the equation: NisotypeNEBNA1 = N0 × (Econst)n(isoytpe)N0 × (Econst)n(EBNA1); in this example, the enrichment is: Nisotype/N0NEBNA1/N0 = 1.8528.8 – 1.8522.4 = 51-fold.
None
Fig. 4. HsORC binds at the DS element or nearby. (A) Enlarged view of oriP. The locations of the PCR fragments used to scan the binding sites of EBNA1 and hsORC are shown below the ruler (sc2–sc10). The ChIP experiment was performed with cross-linked A39 cells. Immunoprecipitations were executed with the chromatin fraction of 1–2 × 10⁷ cells; 1/100 thereof was used for one PCR. The histogram shows the EBNA1 analysis. The difference between the crossing point of the EBNA1 immunoprecipitate and the isotype control is indicated on the y-axis. The graph shows the mean value and standard deviation of three independent experiments. (B) Histogram of DNA fragments accumulated in immunoprecipitates with polyclonal antibodies directed against the hsORC subunits 1, 2 and 3 (see Figure 2). Therefore, triplets are shown for each scanning PCR fragment to illustrate the data for hsORC1, 2 and 3. The mean values and standard deviations are again calculated from three independent experiments. (C) This table summarizes the data of the histograms and calculates the enrichment of the analysed fragments. Each individual Econst of the primer pairs was determined from standard curves of 10-fold dilutions of the immunoprecipitations, using the formula Econst = 10–1/slope (see Figure 3 for details). The cycle differences are shown as mean values of three independent experiments. The enrichment of each fragment was calculated as explained in Figure 3C using the mean values of Econst, and the difference of the crossing points between the specific immunoprecipitations and the pre-immune/isotype immunoprecipitations.
None
Fig. 5. ChIP experiment with P3-ΔDS-33 cells, which carry an EBV genome with a deletion of the DS element in the context of a full-size EBV genome. The experiment was performed and analysed as described in Figure 3 with (A) EBNA1 antibodies and (B) polyclonal antibodies directed against subunits 1, 2 and 3 of the human ORC, respectively.
None
Fig. 6. Human ORC and EBNA1 associate. (A) Characterization of the monoclonal antibodies directed against hsORC1 and hsORC3. Bacterially expressed His-tagged C-terminal domains of hsORC1 and hsORC3 were used for the generation of antibodies in rats. Monoclonal 7A7 detects a protein of 105 kDa as the polyclonal hsORC1 antibody, whereas 6D1 detects a protein of the same migration pattern as the polyclonal hsORC3 antibody. The respective signals are indicated with an arrow. Extracts of 4 × 10⁵ cells were loaded per lane, the dilutions used are indicated. (B) Native nuclear proteins that were released from the chromatin of logarithmically proliferating A39 cells were immunoprecipitated by using the antibodies indicated at the top: pre-immune serum (pre), hsORC1, hsORC2, hsORC3 and EBNA1 (EB1). HsORC immunoprecipitations were performed with the polyclonal antibodies used for the ChIP experiment, or with the monoclonal antibody 1H4 directed against EBNA1. The antibodies used for immunodetection are indicated on the left. The polyclonal antibody was used for the detection of hsORC2, and monoclonal antibodies 7A7 and 6D1 (see A) were used for the detection of hsORC1 and hsORC3, respectively. A shorter exposure of the EBNA1 immunoprecipitate detected with the 1H4 antibody is shown in the inset in the rightmost lower panel.

References

    1. Abdurashidova G., Riva,S., Biamonti,G., Giacca,M. and Falaschi,A. (1998) Cell cycle modulation of protein–DNA interactions at a human replication origin. EMBO J., 17, 2961–2969. - PMC - PubMed
    1. Abdurashidova G., Deganuto,M., Klima,R., Riva,S., Biamonti,G., Giacca,M. and Falaschi,A. (2000) Start sites of bidirectional DNA synthesis at the human lamin B2 origin. Science, 287, 2023–2026. - PubMed
    1. Adams A. (1987) Replication of latent Epstein–Barr virus genomes in Raji cells. J. Virol., 61, 1743–1746. - PMC - PubMed
    1. Aiyar A., Tyree,C. and Sugden,B. (1998) The plasmid replicon of EBV consists of multiple cis-acting elements that facilitate DNA synthesis by the cell and a viral maintenance element. EMBO J., 17, 6394–6403. - PMC - PubMed
    1. Aladjem M.I., Rodewald,L.W., Kolman,J.L. and Wahl,G.M. (1998) Genetic dissection of a mammalian replicator in the human β-globin locus. Science, 281, 1005–1009. - PubMed

Publication types