

pH-enhanced cytopathic effects of Clostridium sordellii lethal toxin
- PMID: 11500421
- PMCID: PMC98661
- DOI: 10.1128/IAI.69.9.5487-5493.2001
pH-enhanced cytopathic effects of Clostridium sordellii lethal toxin
Abstract
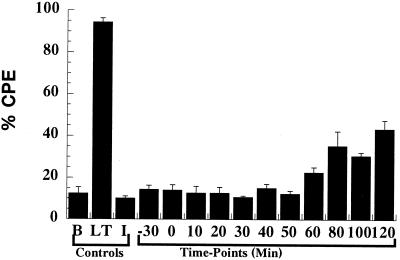
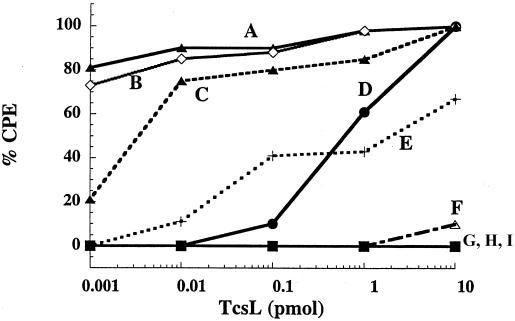
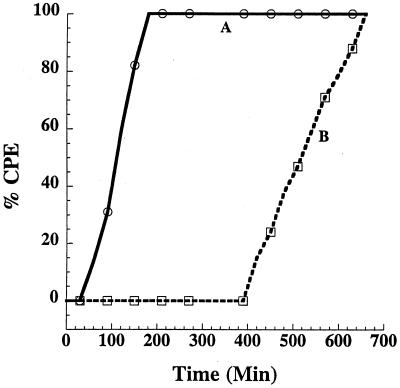
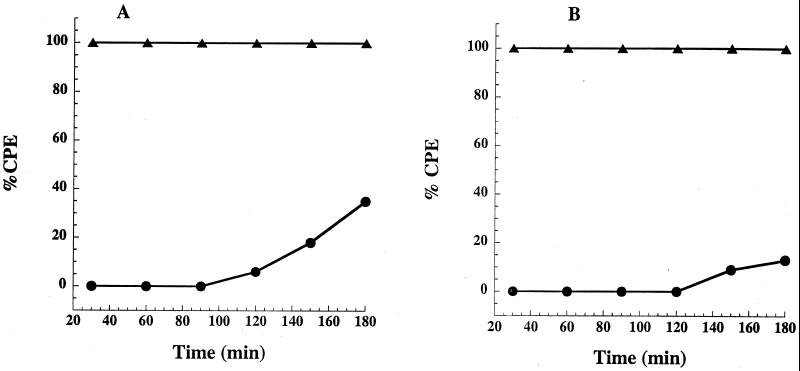
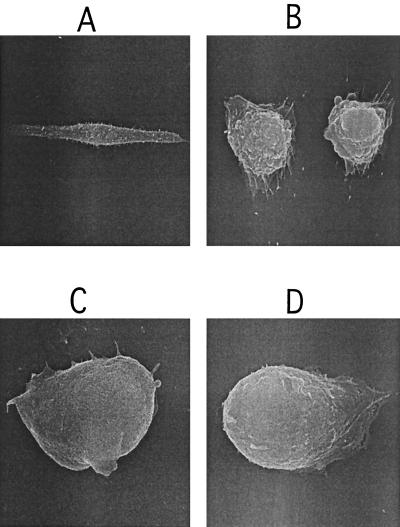
Clostridium sordellii lethal toxin (TcsL) is a large clostridial toxin (LCT) that glucosylates Ras, Rac, and Ral. TcsL differs from other LCTs because it modifies Ras, which does not cycle from cytosol to membrane. By using a suite of inhibitors, steps in cell entry by TcsL were dissected, and entry appears to be dependent on endosomal acidification. However, in contrast to TcdB, TcsL was substantially slower in its time course of entry. TcsL cytopathic effects (CPE) were blocked by bafilomycin A1 and neutralized by antiserum up to 2 h following treatment of cells with the toxin. The slow time course of intoxication and relatively high cytopathic dose were alleviated by exposing TcsL to acid pH, resulting in a time course similar to that of TcdB. The optimal pH range for activation was 4.0 to 5.0, which increased the rate of intoxication over 5-fold, lowered the minimal intoxicating dose by over 100-fold, and allowed complete substrate modification within 2 h, as shown by differential glucosylation. Fluorescence analysis of TcsL with 2-(p-toluidinyl) naphthalene-6-sulfonic acid as a probe suggested the acid pH stimulated a hydrophobic transition in the protein, a likely prelude to membrane insertion. Finally, acid entry by TcsL caused TcdB-like morphological changes in CHO cells, which suggesting that acid activation may impact substrate recognition profiles for TcsL.
Figures
Similar articles
-
Clostridium sordellii lethal toxin is maintained in a multimeric protein complex.Infect Immun. 2004 Jun;72(6):3366-72. doi: 10.1128/IAI.72.6.3366-3372.2004. Infect Immun. 2004. PMID: 15155642 Free PMC article.
-
Large Clostridial Toxins: Mechanisms and Roles in Disease.Microbiol Mol Biol Rev. 2021 Aug 18;85(3):e0006421. doi: 10.1128/MMBR.00064-21. Epub 2021 Jun 2. Microbiol Mol Biol Rev. 2021. PMID: 34076506 Free PMC article. Review.
-
Specific inhibition of phorbol ester-stimulated phospholipase D by Clostridium sordellii lethal toxin and Clostridium difficile toxin B-1470 in HEK-293 cells. Restoration by Ral GTPases.J Biol Chem. 1998 Mar 27;273(13):7413-22. doi: 10.1074/jbc.273.13.7413. J Biol Chem. 1998. PMID: 9516439
-
Haemorrhagic toxin and lethal toxin from Clostridium sordellii strain vpi9048: molecular characterization and comparative analysis of substrate specificity of the large clostridial glucosylating toxins.Cell Microbiol. 2014 Nov;16(11):1706-21. doi: 10.1111/cmi.12321. Epub 2014 Aug 4. Cell Microbiol. 2014. PMID: 24905543
-
Functional implications of lethal toxin-catalysed glucosylation of (H/K/N)Ras and Rac1 in Clostridium sordellii-associated disease.Eur J Cell Biol. 2011 Nov;90(11):959-65. doi: 10.1016/j.ejcb.2010.10.009. Epub 2010 Dec 4. Eur J Cell Biol. 2011. PMID: 21134703 Review.
Cited by
-
Clostridium sordellii lethal toxin is maintained in a multimeric protein complex.Infect Immun. 2004 Jun;72(6):3366-72. doi: 10.1128/IAI.72.6.3366-3372.2004. Infect Immun. 2004. PMID: 15155642 Free PMC article.
-
Genome-Wide CRISPR Screen Identifies Semaphorin 6A and 6B as Receptors for Paeniclostridium sordellii Toxin TcsL.Cell Host Microbe. 2020 May 13;27(5):782-792.e7. doi: 10.1016/j.chom.2020.03.007. Epub 2020 Apr 16. Cell Host Microbe. 2020. PMID: 32302524 Free PMC article.
-
Mutational analysis of the enzymatic domain of Clostridium difficile toxin B reveals novel inhibitors of the wild-type toxin.Infect Immun. 2003 Jun;71(6):3294-301. doi: 10.1128/IAI.71.6.3294-3301.2003. Infect Immun. 2003. PMID: 12761111 Free PMC article.
-
The Helicobacter pylori flaA1 and wbpB genes control lipopolysaccharide and flagellum synthesis and function.J Bacteriol. 2004 Apr;186(8):2253-65. doi: 10.1128/JB.186.8.2253-2265.2004. J Bacteriol. 2004. PMID: 15060026 Free PMC article.
-
Large Clostridial Toxins: Mechanisms and Roles in Disease.Microbiol Mol Biol Rev. 2021 Aug 18;85(3):e0006421. doi: 10.1128/MMBR.00064-21. Epub 2021 Jun 2. Microbiol Mol Biol Rev. 2021. PMID: 34076506 Free PMC article. Review.
References
-
- Aktories K, Schmidt G, Just I. Rho GTPases as targets of bacterial protein toxins. Biol Chem. 2000;381:421–426. - PubMed
-
- Bar-Sagi D, Hall A. Ras and Rho GTPases: a family reunion. Cell. 2000;103:227–238. - PubMed
-
- Barth H, Pfeifer G, Hofmann F, Maier E, Benz R, Aktories K. Low pH-induced formation of ion channels by Clostridium difficile toxin B in target cells. J Biol Chem. 2001;276:10670–10676. - PubMed
-
- Boquet P. Bacterial toxins inhibiting or activating small GTP-binding proteins. Ann N Y Acad Sci. 1999;886:83–90. - PubMed
Publication types
MeSH terms
Substances
LinkOut - more resources
Full Text Sources
Other Literature Sources
Research Materials
Miscellaneous
