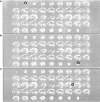
Non-stationary distributed source approximation: an alternative to improve localization procedures
- PMID: 11500992
- PMCID: PMC6871930
- DOI: 10.1002/hbm.1043
Non-stationary distributed source approximation: an alternative to improve localization procedures
Abstract
Localization of the generators of the scalp measured electrical activity is particularly difficult when a large number of brain regions are simultaneously active. In this study, we describe an approach to automatically isolate scalp potential maps, which are simple enough to expect reasonable results after applying a distributed source localization procedure. The isolation technique is based on the time-frequency decomposition of the scalp-measured data by means of a time-frequency representation. The basic rationale behind the approach is that neural generators synchronize during short time periods over given frequency bands for the codification of information and its transmission. Consequently potential patterns specific for certain time-frequency pairs should be simpler than those appearing at single times but for all frequencies. The method generalizes the FFT approximation to the case of distributed source models with non-stationary time behavior. In summary, the non-stationary distributed source approximation aims to facilitate the localization of distributed source patterns acting at specific time and frequencies for non-stationary data such as epileptic seizures and single trial event related potentials. The merits of this approach are illustrated here in the analysis of synthetic data as well as in the localization of the epileptogenic area at seizure onset in patients. It is shown that time and frequency at seizure onset can be precisely detected in the time-frequency domain and those localization results are stable over seizures. The results suggest that the method could also be applied to localize generators in single trial evoked responses or spontaneous activity.
Copyright 2001 Wiley-Liss, Inc.
Figures


Similar articles
-
Epileptogenic Source Imaging Using Cross-Frequency Coupled Signals From Scalp EEG.IEEE Trans Biomed Eng. 2016 Dec;63(12):2607-2618. doi: 10.1109/TBME.2016.2613936. IEEE Trans Biomed Eng. 2016. PMID: 27875126
-
Source localization of ictal epileptic activity based on high-density scalp EEG data.Epilepsia. 2017 Jun;58(6):1027-1036. doi: 10.1111/epi.13749. Epub 2017 Apr 11. Epilepsia. 2017. PMID: 28398008
-
Source localization of ictal epileptic activity investigated by high resolution EEG and validated by SEEG.Neuroimage. 2010 Jun;51(2):642-53. doi: 10.1016/j.neuroimage.2010.02.067. Epub 2010 Mar 4. Neuroimage. 2010. PMID: 20206700
-
Defining epileptogenic networks: Contribution of SEEG and signal analysis.Epilepsia. 2017 Jul;58(7):1131-1147. doi: 10.1111/epi.13791. Epub 2017 May 20. Epilepsia. 2017. PMID: 28543030 Review.
-
Electroencephalography, magnetoencephalography and source localization: their value in epilepsy.Curr Opin Neurol. 2018 Apr;31(2):176-183. doi: 10.1097/WCO.0000000000000545. Curr Opin Neurol. 2018. PMID: 29432218 Review.
Cited by
-
Spatio-temporal dynamics of adaptation in the human visual system: a high-density electrical mapping study.Eur J Neurosci. 2015 Apr;41(7):925-39. doi: 10.1111/ejn.12849. Epub 2015 Feb 16. Eur J Neurosci. 2015. PMID: 25688539 Free PMC article.
-
A glimpse into your vision.Hum Brain Mapp. 2007 Jul;28(7):614-24. doi: 10.1002/hbm.20302. Hum Brain Mapp. 2007. PMID: 17133389 Free PMC article.
-
Spatiotemporal scales and links between electrical neuroimaging modalities.Med Biol Eng Comput. 2011 May;49(5):511-20. doi: 10.1007/s11517-011-0769-4. Epub 2011 Apr 12. Med Biol Eng Comput. 2011. PMID: 21484504 Review.
-
Brain and cognitive reserve: Translation via network control theory.Neurosci Biobehav Rev. 2017 Apr;75:53-64. doi: 10.1016/j.neubiorev.2017.01.016. Epub 2017 Jan 16. Neurosci Biobehav Rev. 2017. PMID: 28104411 Free PMC article. Review.
-
Improved Localization of Seizure Onset Zones Using Spatiotemporal Constraints and Time-Varying Source Connectivity.Front Neurosci. 2017 Apr 6;11:156. doi: 10.3389/fnins.2017.00156. eCollection 2017. Front Neurosci. 2017. PMID: 28428738 Free PMC article.
References
-
- Achim A, Richer F, Saint‐Hilaire J. 1991. Methodological considerations for the evaluation of spatio‐temporal source models. Electroencephalogr Clin Neurophysiol 79: 227–240. - PubMed
-
- Blanke O, Lantz G, Seeck M, Spinelli L, Grave de Peralta Menendez R, Thut G, Landis T, Michel CM. 2000. Temporal and spatial determination of EEG seizure onset in the frequency domain. Clin Neurophysiol 111: 763–772. - PubMed
-
- Boudreaux‐Bartel GF. 1996. Mixed time‐frequency signal transformations In: Poularikas A, editor. The transforms and applications handbook. Boca Raton: CRC Press; p 887–963.
-
- Cabrera Fernandez D, Grave de Peralta R, Gonzalez Andino S. 1995. Some limitations of spatio temporal source models. Brain Topogr 7: 233–243. - PubMed
-
- Dierks T, Engelhart W, Maurer K. 1993. Equivalent dipoles of FFT data visualize drug interaction at benzodiazepine receptors. Electroencephalogr Clin Neurophysiol 86: 231–237. - PubMed
Publication types
MeSH terms
LinkOut - more resources
Full Text Sources

